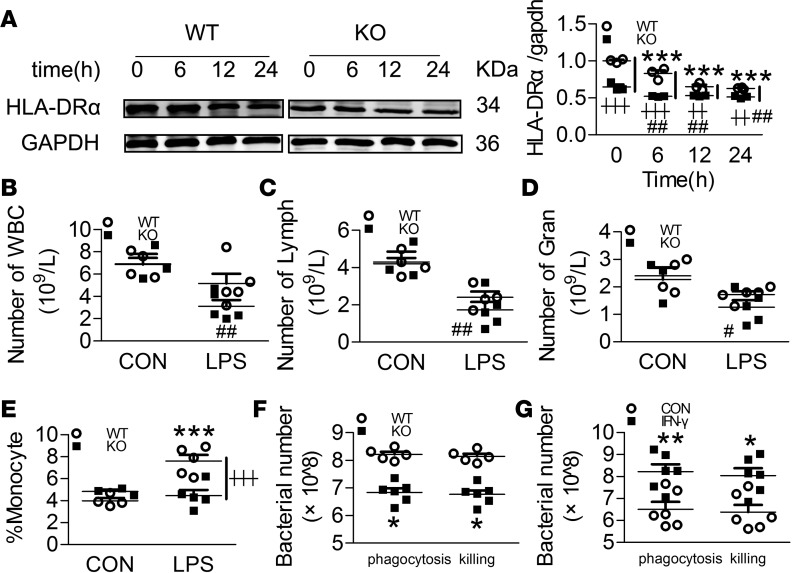
Figure 7. Swiprosin-1 deficiency impairs the LPS-induced immune activation in peritoneal macrophages.
(A) The expression of HLA-DRα in macrophages after LPS treatment (n = 3, ***P < 0.001 WT-LPS vs. WT-0 hour; ##P < 0.01, KO-LPS vs. KO-0 hour; ┼┼P < 0.01, ┼┼┼P < 0.001, WT-LPS vs. KO-LPS at the same time point), 1-way ANOVA (LSD test); the results are depicted as the mean ± SEM. (B–D) Numbers of white blood cells (WBC), lymphocytes (Lymph), and granulocytes (Gran) in the blood after LPS treatment for 6 hours (n = 3–5, #P < 0.05, ##P < 0.01, KO-LPS vs. KO-CON), 1-way ANOVA (LSD test); the results are depicted as the mean ± SEM. (E) Percentage of monocytes in the blood after LPS treatment for 6 hours (n = 5, ***P < 0.001, WT-LPS vs. WT-CON; ┼┼┼P < 0.001, WT-LPS vs. KO-LPS), 1-way ANOVA (LSD test); the results are depicted as the mean ± SEM. (F) Phagocytosis and bacteria-killing ability in the macrophages (n = 6, *P < 0.05, WT vs. KO), 2-tailed t test; the results are depicted as the mean ± SEM. (G) Phagocytosis and bacteria-killing ability in the swiprosin-1–KO macrophages after IFN-γ (50 ng/ml) treatment (n = 6, *P < 0.05, **P < 0.01, IFN-γ vs. CON), 2-tailed t test; the results are depicted as the mean ± SEM.

