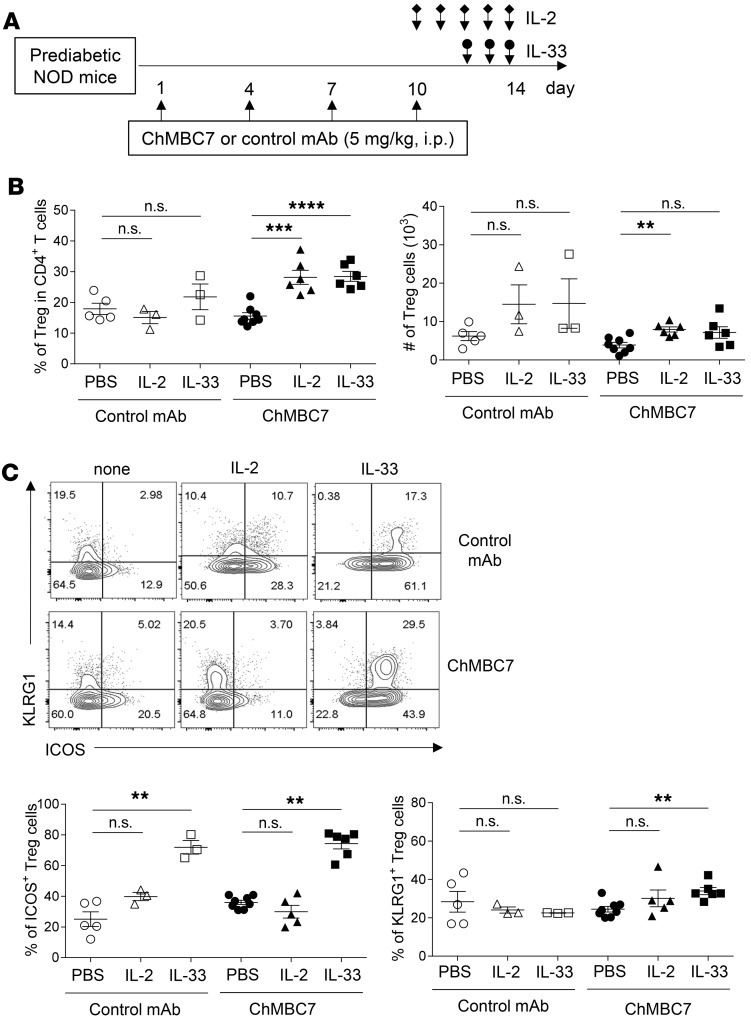
Figure 7. A combination of CD122 blockade and Treg-trophic cytokines promotes effector Treg expansion in vivo.
(A) Schematic diagram showing experimental design. Ten-week-old female prediabetic NOD mice were treated with control mAb (n = 5), control mAb + IL-2 (n = 3), control mAb + IL-33 (n = 3), anti-CD122 (chMBC7) (n = 8), anti-CD122 + IL-2 (n = 6), or anti-CD122 + IL-33 (n = 6) for 2 weeks. (B) The percentages and total numbers of Tregs from the pancreatic islets of the mice under each treatment condition. (C) Representative FACS plots (upper) and statistics (lower) of KLRG1 and ICOS expression in Tregs from indicated groups as in A. Statistical data are mean ± SEM. Data are representative of 3 independent experiments. P values are calculated using 1-way ANOVA with a Tukey multiple comparison test. **P < 0.01; ****P < 0.0001.

