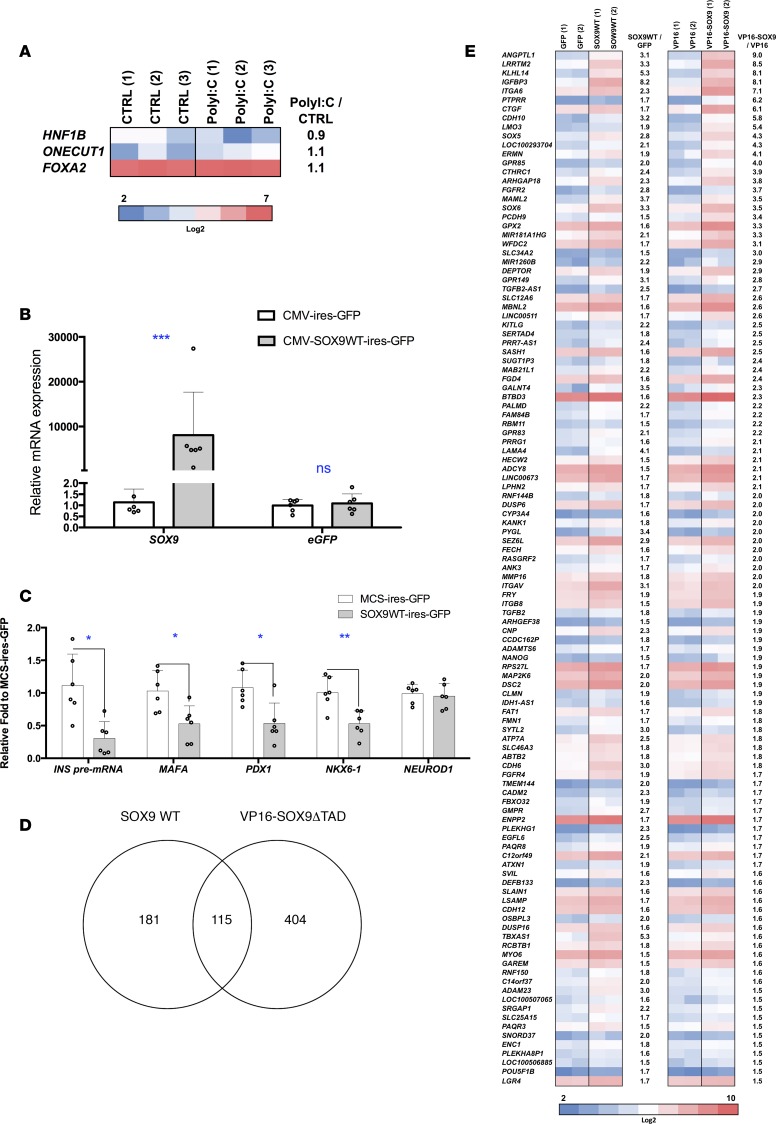
Figure 6. Genes induced in EndoC-βH1 cells by SOX9.
(A) EndoC-βH1 cells were either mock transfected (CTRL) or transfected with PolyI:C and analyzed 24 hours later. Heatmap from global transcriptomic analysis represents previously described SOX9 target genes (n = 3). (B–E) EndoC-βH1 cells were transfected with MCS-ires-GFP, SOX9WT-ires-GFP, VP16-ires-GFP, or VP16-SOX9ΔTAD-ires-GFP plasmid. GFP+ cells were sorted by FACS 48 hours later and RNAs were prepared (n = 2–6). (B and C) RT-qPCR analyses (n = 6). (D and E) Global transcriptomic analyses with Venn diagram and heatmap that represent genes upregulated (>1.5-fold) by SOX9WT-ires-GFP and VP16-SOX9ΔTAD-ires-GFP (n = 2). Data from RT-qPCR represent the mean ± SD. *P < 0.05, **P < 0.01 and ***P < 0.001 relative to control by Student’s t test. ns, not significant.

