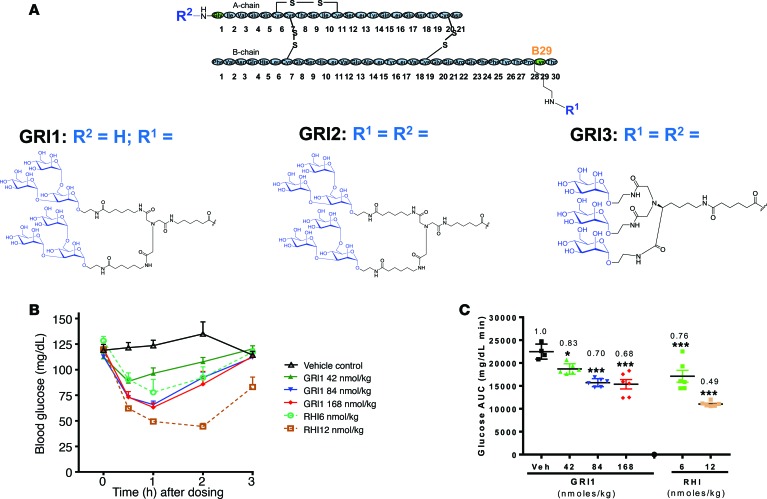
Figure 1. Mannosylated insulin analog shows differential glucose-lowing profile compared with RHI.
(A) Schematics of GRI1, GRI2, and GRI3 molecules with their sugar and linker structures. (B) GRI1-induced glucose lowering in C57BL/6 mice after a single s.c. injection. (C) Glucose AUC was calculated, and fold changes over vehicle are shown. n = 4–6 per group. *P < 0.05, ***P < 0.001 vs. vehicle group by 2-way ANOVA with Dunnett’s test. Results are shown as mean ± SEM of values and represent 3 independent experiments.

