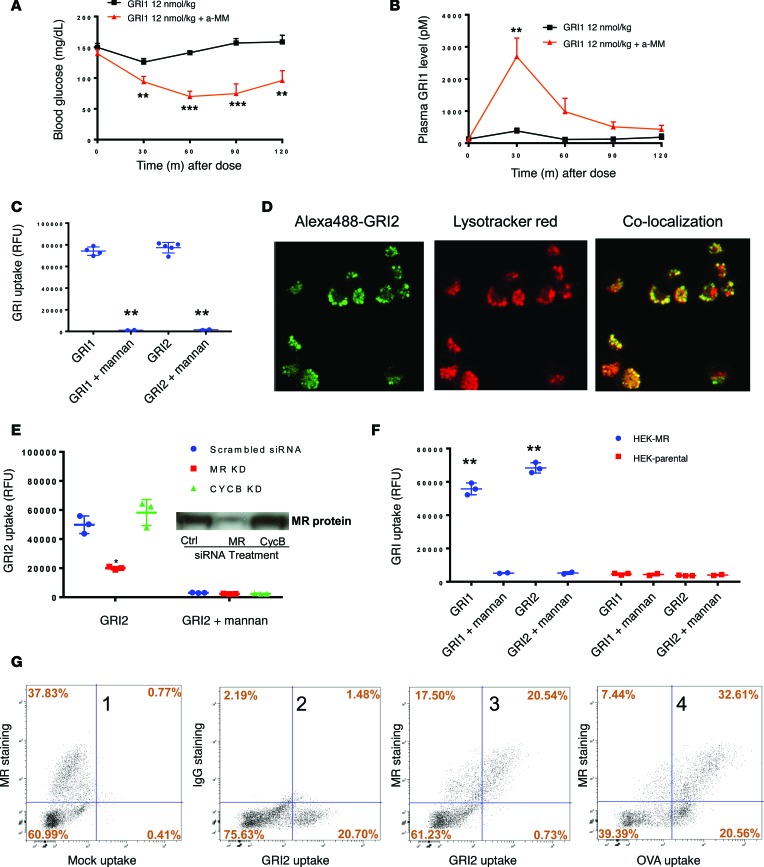
Figure 4. Cellular MR levels correlate with GRI clearance.
(A) Glucose lowering by GRI1 in C57BL/6 mice was assessed in the absence or presence of α-MM coinjection, and corresponding GRI1 plasma levels are shown in B. n = 8 per group. **P < 0.01, ***P < 0.001 vs. GRI1 alone group by 1-way ANOVA with Tukey’s test. (C) High-content imaging analysis of cellular uptake of Alexa488-labeled GRI1 and GRI2 in the presence or absence of 10 mg/ml mannan in cultured rat macrophage NR8383 cells. n = 2–5 per group. **P < 0.01 corresponding GRI vs. GRI + mannan by Student’s t test. (D) Cellular uptake of GRI2 and lysosome staining by LysoTracker are measured in cultured rat macrophage NR8383 cells. Original magnification, ×40. (E) siRNA-mediated knockdown of MR and corresponding GRI uptake in NR8383 cells. n = 3 per group. *P < 0.05 vs. scrambled siRNA group by Student’s t test. A 57% reduction of GRI2 uptake corresponded to a 65% reduction of MR protein. Western blot detection of MR protein is shown in E. (F) Overexpression of human MR in HEK293 cells and corresponding GRI1 and GRI2 uptake are shown in the presence or absence of 10 mg/ml mannan. n = 2–3 per group. **P < 0.01 vs. corresponding GRI uptake in parental HEK cells by Student’s t test. (G) Representative FACS analysis of GRI2 and OVA uptake in primary human liver cell mixture is shown. The x axis represents medium fluorescence intensity of Alexa488-labeled GRI2/OVA in each cell. The y axis represents medium fluorescence intensity of APC-labeled MR/IgG antibodies only detecting membrane-expressing MR in each cell. Results are shown as mean ± SEM (A and B) or mean ± SD (C, E, and F). Results represent 2 (F) or 3 independent experiments (A, B, C, E, and G).

