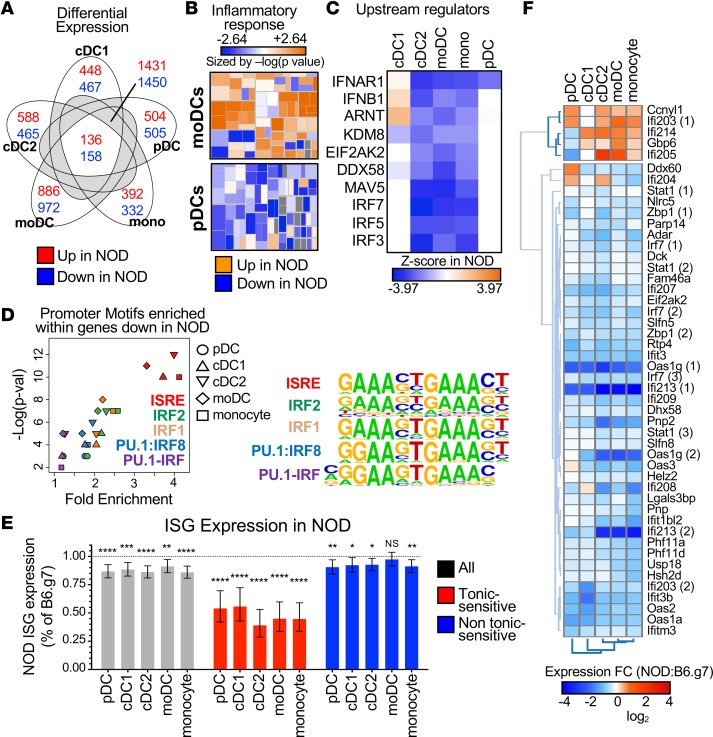
Figure 1. Tonic-sensitive IFN-I response genes are lower in 5 key APC subsets in adult prediabetic NOD mice.
(A) Venn diagram of upregulated (red) and downregulated (blue) DE genes in APC subsets. Numbers are shown for DE genes unique to one subset, shared by all subsets, or shared by at least 2 subsets but not all. (B) IPA heat map for inflammatory gene pathways for moDCs and pDCs in NOD mice compared with B6.g7 mice. Each box was sized by the log(P value) and colored by the Z score. (C) Hierarchical clustering of significant IPA upstream regulators with lower expression in NOD mice, as ranked by the Z score. Z score indicates the predicted activity of the upstream regulator in NOD mice compared with B6.g7 mice. (D) Fold enrichment and –log(P value) are plotted for promoters motifs enriched in transcripts expressed lower in NOD mice compared with B6.g7 mice. Motifs shown are enriched (P < 0.1) in at least 4 of the DC subsets. Motifs are color coded, and DC subsets are represented by shape. Aligned logos represent the enriched motifs. (E) NOD ISG expression as a percentage of B6.g7 ISG expression for all ISGs (gray), tonic-sensitive ISGs (red), and ISGs that are not tonic-sensitive (blue). (F) Heat map of average fold change (NOD-B6.g7) for tonic-sensitive ISGs that are significant in at least 1 subset. Experiments were performed twice with 3 mice/group for each time. All replicates were averaged for each gene to obtain the average log2 expression value. Paired t test was performed for each DC subset on the ISG groups by comparing B6.g7 with NOD mice. Data are plotted as mean with 95% confidence intervals. *P < 0.05, **P < 0.01, ***P < 0.001, ****P < 0.0001.

