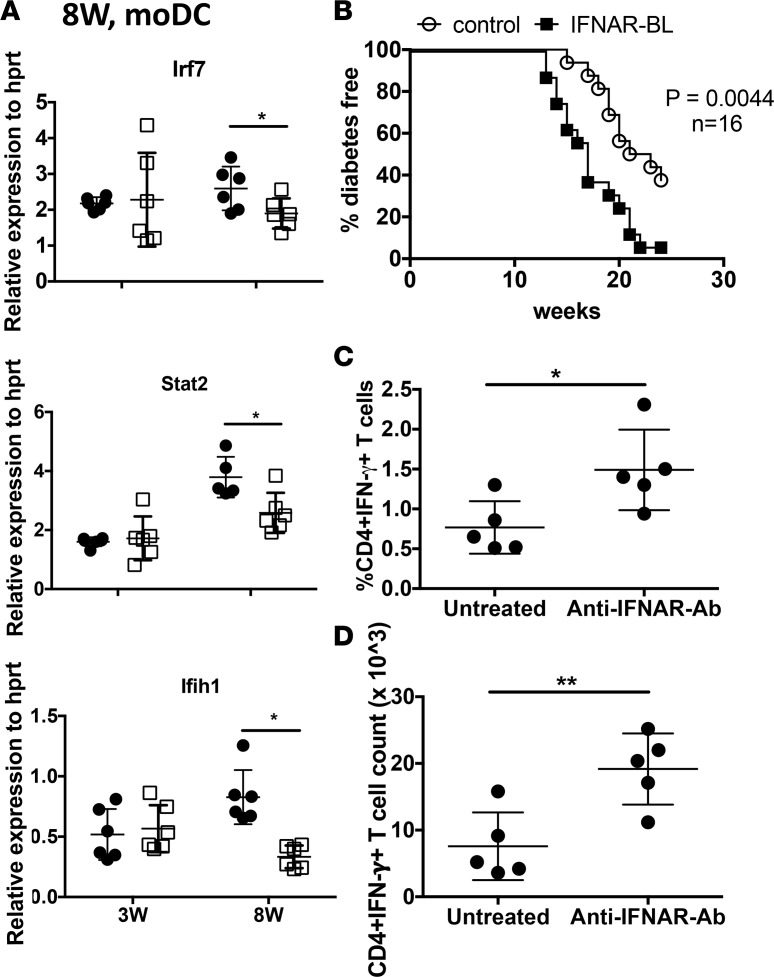
Figure 2. Lower IFN response genes correlate with diabetes pathogenesis, and blocking IFNAR in prediabetic NOD mice accelerates diabetes and increases Th1 responses.
(A) Type I IFN gene expression in sorted splenic moDCs from age-matched NOD and B6.g7 mice. (B) NOD mice were treated i.p. with anti-IFNAR1 antibody or control monoclonal antibody 2 times/week from 6–8 weeks of age. The percentage of diabetes-free mice was recorded and compared between the anti–IFNAR antibody–treated group and untreated control group. Statistical analysis was performed with log-rank test. Summation of 2 experiments with n = 16 mice (C) Intracellular IFN-γ staining in lymph node–derived CD4+ T cells, after PMA plus ionomycin (Ion) stimulation (total 6 hours), where brefeldin A was added for the last 4 hours. (D) Counts of intracellular CD4+IFN-γ+ T cells in lymph node after PMA plus Ion stimulation. Data were pooled from 2 independent experiments, with 5–6 mice per group (A, C, and D). Values show individual mice, with mean ± SD. P values in A, C and D were calculated using t test. *P < 0.05, **P < 0.01.

