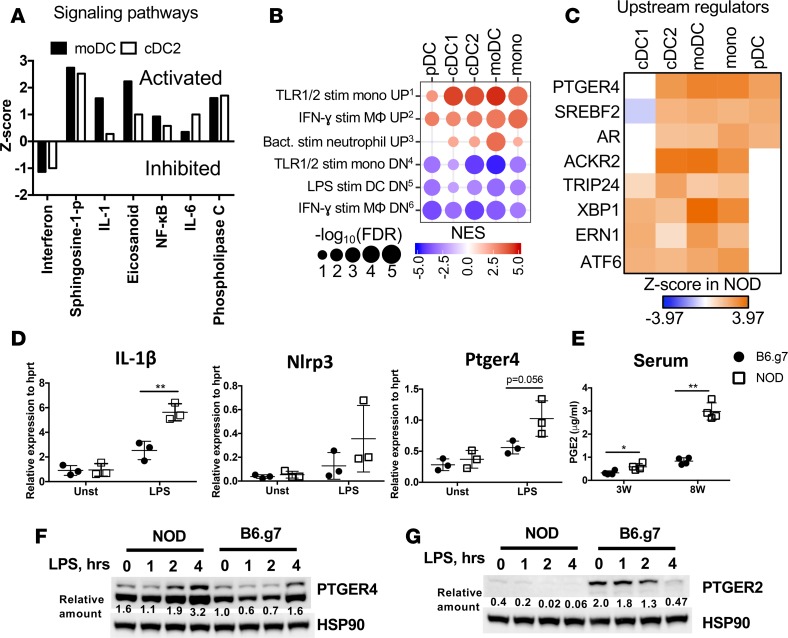
Figure 3. Inflammatory signature identified in NOD APCs correlates with increased PTGER4 and PGE2.
(A) Z scores for IPA signaling pathways significantly altered in moDCs and cDC2 from NOD versus B6.g7 mice. (B) Bubble plots of key inflammatory gene sets from GSEA of NOD APCs compared with B6.g7 APCs using the immunologic signatures gene sets from MSigDB. Gene sets enriched with genes with lower expression in NOD mice compared with B6.g7 mice are depicted as blue circles, while gene sets with higher expression in NOD mice are depicted as red circles. Circle size indicates FDR-adjusted P values, and color intensity indicates normalized enrichment scores. (C) Hierarchical clustering of significant IPA upstream regulators with increased expression in NOD mice as ranked by Z score, which indicates the predicted enrichment in NOD mice compared with B6.g7 mice. (D) Gene expression measured by qPCR for IL-1β, Nlrp3, and Ptger4 after 4 hours of LPS stimulation of spleen cells from 8-week-old prediabetic NOD and B6.g7 mice. Plots are representative of 2 independent experiments with 3 mice per group. (E) PGE2 levels in sera from NOD and B6.g7 mice (representative of 2 experiments, 3 mice per group) at weeks 3 and 8. Comparison was made between NOD and B6.g7 mice; P values were calculated using t test. Data show mean ± SD. (F and G) Protein expression level by Western blot of PTGER4 and PTGER2 in bone marrow–derived DCs from NOD and B6.g7 mice, from 0–4 hours after LPS (500 ng/ml) stimulation. Relative quantification of bands normalization to HSP90 is indicated underneath. *P < 0.05, **P < 0.01.

