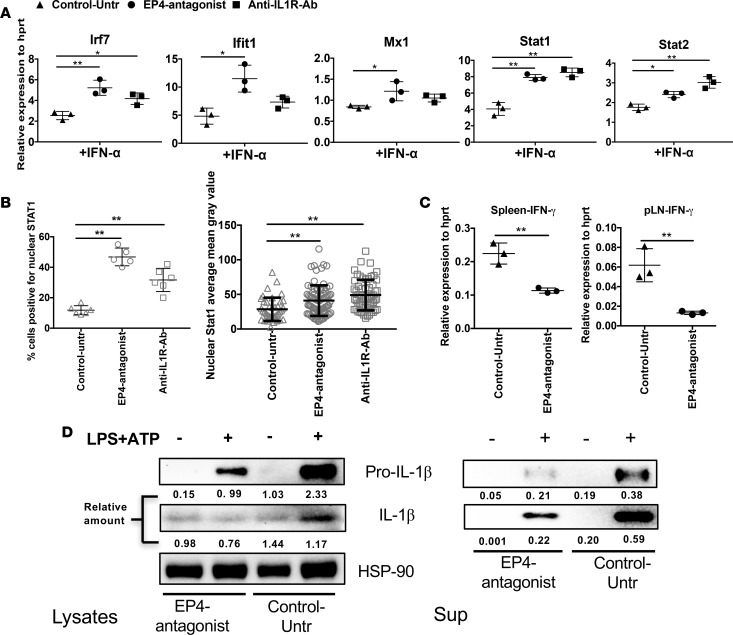
Figure 6. In vivo PTGER4 antagonist treatment increases IFNAR signaling but decreases IL-1 and IFN-γ.
(A) Total splenocytes from NOD mice treated with PTGER4 antagonist or anti–IL-1R as indicated were stimulated with IFN-α for 2 hours, and IFN-I–response gene expression was determined by qPCR. (B) IFN-α–stimulated STAT1 nuclear localization. Spleen cells from untreated or treated (PTGER4 antagonist/anti-IL1R-antibody) NOD mice were stimulated with IFN-α for 30 minutes, and nuclear STAT1 localization was determined by confocal microscopy, as in Supplemental Figure 1B. Images (15/slide) were quantified to determine the percentage of CD11c+ cells positive for nuclear STAT1 and the intensity of STAT1 levels within CD11C+ population. (C) IFN-γ transcripts were measured in mixed cells prepared from spleen or pancreatic lymph nodes, 4 weeks after treatment with or without PTGER4 antagonist. (D) Four weeks after treatment with or without PTGER4 antagonist, CD11c+ cells were enriched from the spleen, and IL-1 protein levels were detected by Western blotting. Protein bands were quantified relative to HSP90 (lysate) or total cell number (supernatant). Data are representative of at least 2 independent experiments performed with 3 individual mice per group (A and C) or pooled from 3 mice (B and D), mean ± SD for each of the experiments (A–C). Statistical analysis was performed with 1-way ANOVA with Bonferroni post-test. *P < 0.05, **P < 0.01.

