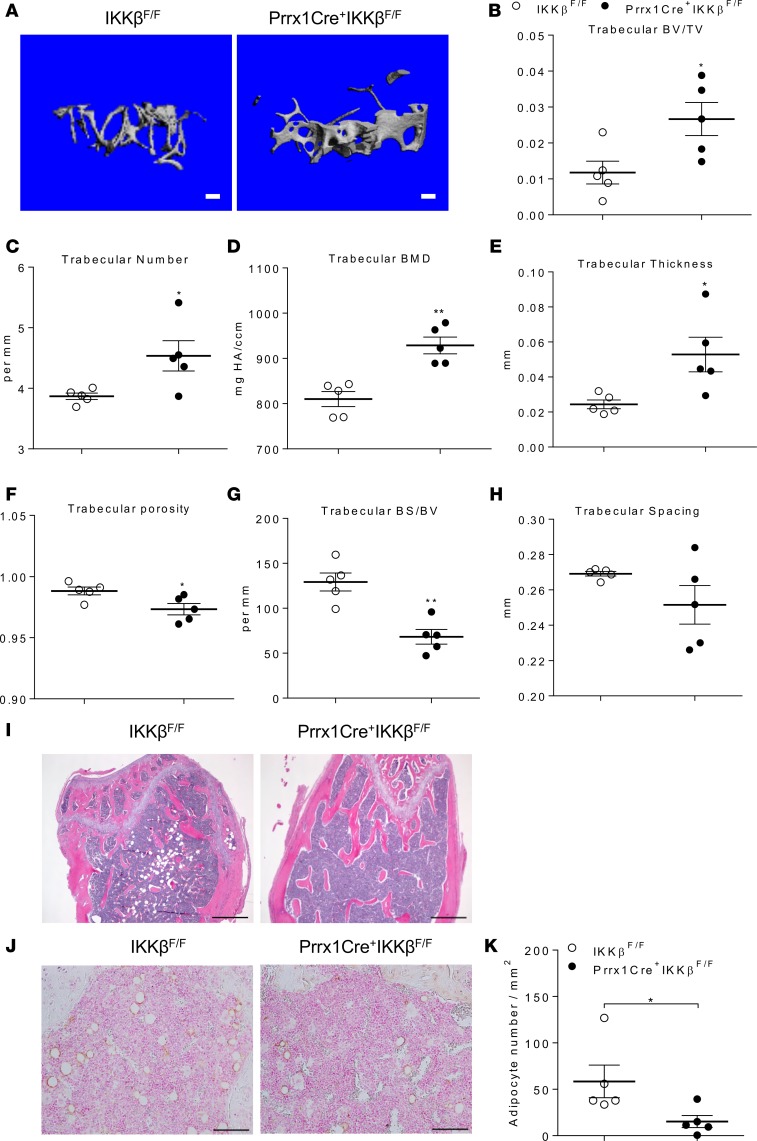
Figure 10. Deficiency of IKKβ in BMMSCs increases bone mass in vivo.
(A) MicroCT reconstruction images of trabecular bone from the femur metaphysis of 20-week-old IKKβF/F and Prrx1Cre+IKKβF/F littermate mice. Scale bar: 100 μm. (B–H) MicroCT analyses of trabecular bone volume/total volume (BV/TV) (B), number (C), BM density (BMD) (D), thickness (E), porosity (F), bone surface/bone volume (G), and spacing (H) in the femur metaphysis of IKKβF/F and Prrx1Cre+IKKβF/F mice (n = 5). (I and J) Representative H&E staining (I), IHC for perilipin (J), and quantification of perilipin-positive adipocytes (K) in femurs (n = 5). Scale bar: 500 μm (I) or 100 μm (J). Error bars represent ± SEM. Significance was determined by Student’s t test (B-H, and K). *P < 0.05; **P < 0.01.

