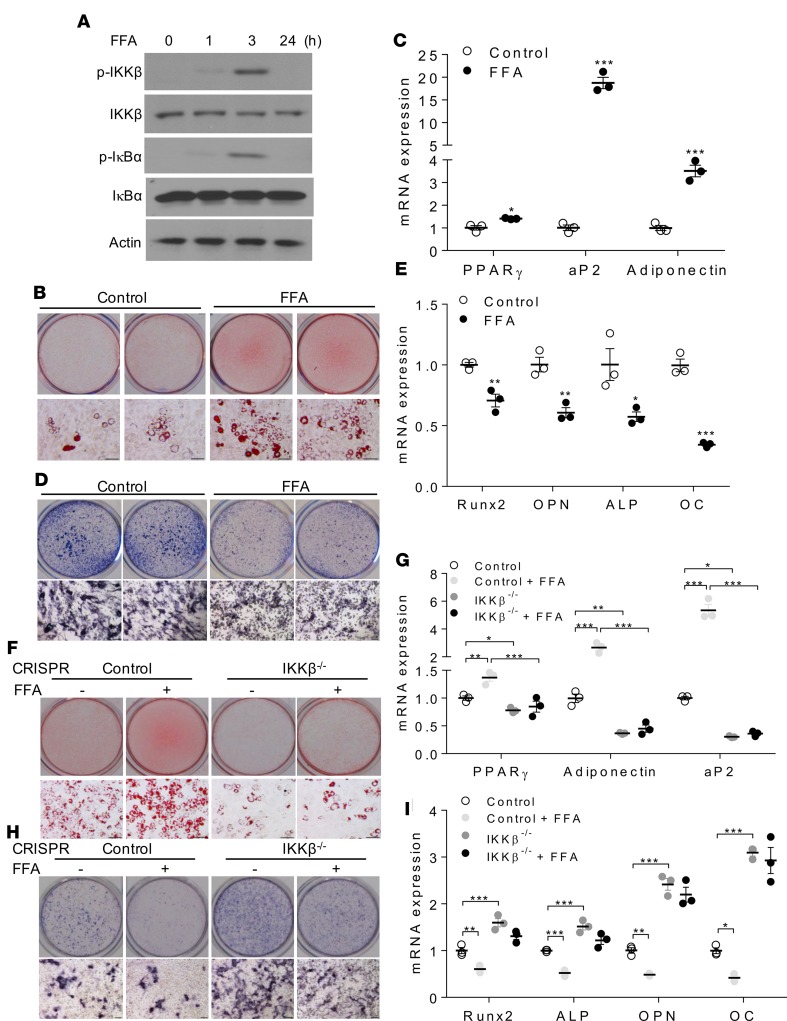
Figure 4. FFAs regulate adipogenesis and osteogenesis of MSCs through IKKβ signaling.
(A) Immunoblotting for phosphorylated and total IKKβ and IκBα proteins of C3H/10T1/2 cells treated with vehicle or 0.5 mM FFAs. (B and C) Oil Red O staining (B) and qPCR analysis (C) of control or FFA-treated C3H/10T1/2 cells induced by an adipogenic cocktail (n = 3). Scale bar: 100 μm. (D and E) ALP staining (D) and qPCR analysis (E) of control or FFA-treated C3H/10T1/2 cells induced by an osteogenic cocktail (n = 3). Scale bar: 100 μm. (F and G) Oil Red O staining (F) and qPCR analysis (G) of vehicle or FFA-treated control or IKKβ-deficient C3H/10T1/2 cells induced by an adipogenic cocktail (n = 3). Scale bar: 100 μm. (H and I) ALP staining (H) and qPCR analysis (I) of vehicle or FFA-treated control or IKKβ-deficient C3H/10T1/2 cells induced by an osteogenic cocktail (n = 3). Scale bar: 100 μm. Error bars represent ± SEM. Significance was determined by Student’s t test (C and E) or 2-way ANOVA (G and I). *P < 0.05; **P < 0.01, ***P < 0.001.

