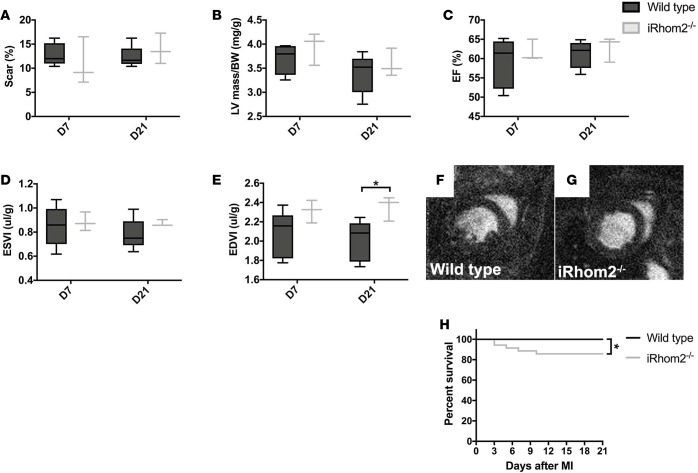
Figure 5. MRI functional parameters and Kaplan-Meier survival curve following myocardial infarction (MI).
(A) Scar size measurements as a percentage of the left ventricle at day 7 (WT, 12.87 ± 2.32; iRhom2-deficient [iRhom2–/–], 10.92 ± 4.95) and day 21 (WT, 12.32 ± 2.26; iRhom2–/–, 13.92 ± 3.16) after MI. (B) Left ventricular mass normalized to body weight (LV/BW, mg/g) shows no changes between wild-type and iRhom2–/– at day 7 (WT, 3.69 ± 0.31; iRhom2–/–, 3.94 ± 0.34) or day 21 (WT, 3.39 ± 0.41; iRhom2–/–, 3.58 ± 0.29). (C) Ejection fraction (EF, %) at day 7 (WT, 58.91 ± 6.43; iRhom2–/–, 61.78 ± 2.81) and day 21 (WT, 61.07 ± 3.55; iRhom2–/–, 62.79 ± 3.26) are comparable. (D) Left ventricular end-systolic volume (ESV) normalized to body mass (ESVI, μl/mg) at day 7 (WT, 0.85 ± 0.17; iRhom2–/–, 0.88 ± 0.08) and day 21 (WT, 0.78 ± 0.13; iRhom2–/–, 0.87 ± 0.03) after MI. (E) Normalized left ventricular end-diastolic volume (EDVI, μl/mg) show no changes at day 7 (WT, 2.07 ± 0.24; iRhom2–/–, 2.31 ± 0.12), but a significant increase in iRhom2–/– animals by day 21 (WT, 2.01 ± 0.21; iRhom2–/–, 2.35 ± 0.13). (F and G) Representative longitudinal short-axis MRI analyses in diastole of infarcted hearts 21 days following MI from (F) wild-type and (G) iRhom2–/– animals. (H) Kaplan-Meier survival curves during the first 21 days after MI show decreased survivability of iRhom2–/– animals compared with wild-type controls (n ≥ 25). Data are shown as the mean ± SEM, n = 5 for MRI analyses, and n ≥ 25 for Kaplan-Meier survivability. *P ≤ 0.05, 1-way ANOVA and post-hoc test.

