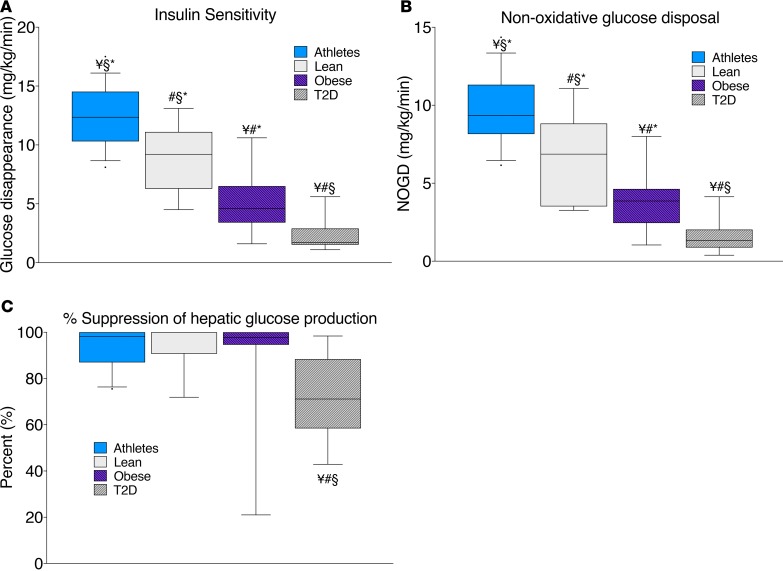
Figure 1. Hyperinsulinemic-euglycemic clamp measurements in endurance-trained athletes, lean controls, obese individuals, and individuals with type 2 diabetes.
Hyperinsulinemic-euglycemic clamp measurements of insulin sensitivity (A), nonoxidative glucose disposal (B), and percentage suppression of hepatic glucose production (C) in endurance-trained athletes, lean controls, obese individuals, and individuals with type 2 diabetes. The box plot shows the median and 25th and 75th percentiles, and the whiskers represent the 10th and 90th percentiles. n = 16 athletes, 14 lean, 15 obese, and 12 T2D. ¥P < 0.05, compared with lean, #P < 0.05, compared with athletes, §P < 0.05, compared with obese,*P < 0.05, compared with T2D, analyzed with 1-way ANOVA.

