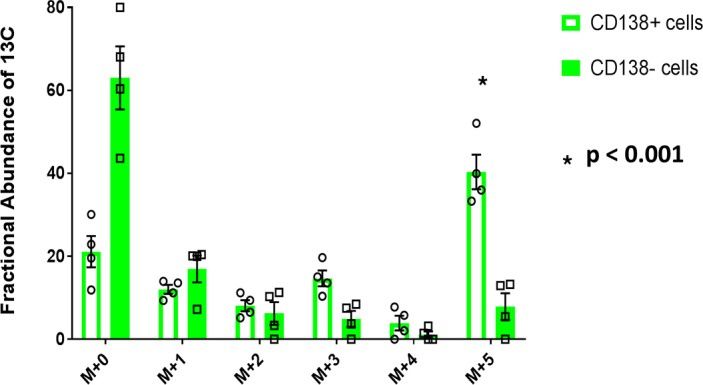
Figure 5. Glutamine uptake is higher in BM plasma cells compared with the remainder of the BM mononuclear cells.

Mass isotopomer distribution of glutamate representing the results of ex vivo glutamine anaplerosis of U[13C5]Glutamine into CD138+ and CD138– cells derived from the BM aspirates of patients with multiple myeloma (MM) (n = 4). Bar graph values represent the averages of the individual data points that overlay the bar graph. The error bars represent ± SEM. Comparisons were made using the 2-tailed Student t test, and significance was defined as P < 0.05.
