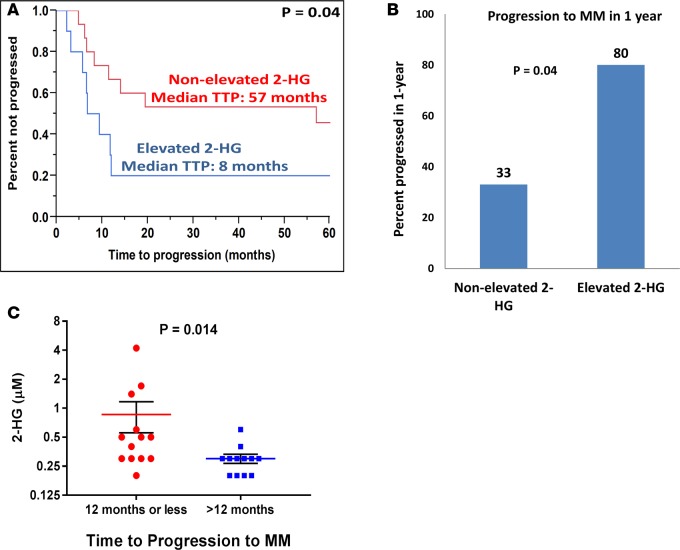
Figure 7. 2-HG levels in the BM supernatant predicts for shorter time to progression of smoldering multiple myeloma to multiple myeloma.
(A) Kaplan-Meier curve showing the time to progression (TTP) of patients with smoldering multiple myeloma (SMM) with a 2-hydroxyglutarate (2-HG) level in the BM supernatant higher than the median 2-HG level (elevated 2-HG) (n = 10) compared with patients with SM) with a 2-HG level in the BM supernatant lower or equal to the median 2-HG levels of the cohort (nonelevated 2-HG) (n = 15). Comparisons were made by the Wilcoxon test, and significance was defined as P < 0.05. (B) Bar graph representing the percentage of SMM patients with 2-HG levels in the BM supernatant higher than the median 2-HG level (elevated 2-HG) (n = 10) or lower than the median 2-HG level (nonelevated 2-HG) (n = 15) who progressed to MM in 1 year from the time of 2-HG level assessment. Comparisons were made by the 2-tailed Fisher’s exact test, and significance was defined as P < 0.05. (C) Dot plot graph depicting the individual (red circles and blue squares), mean (red and blue line), and ± SEM (black error bars) of 2-HG concentrations in the BM supernatant of patients with SMM who progressed to MM within 12 months or less (n = 13) and later than 12 months (n = 12). Comparisons were made by the Mann-Whitney test, and significance was defined as P < 0.05.

