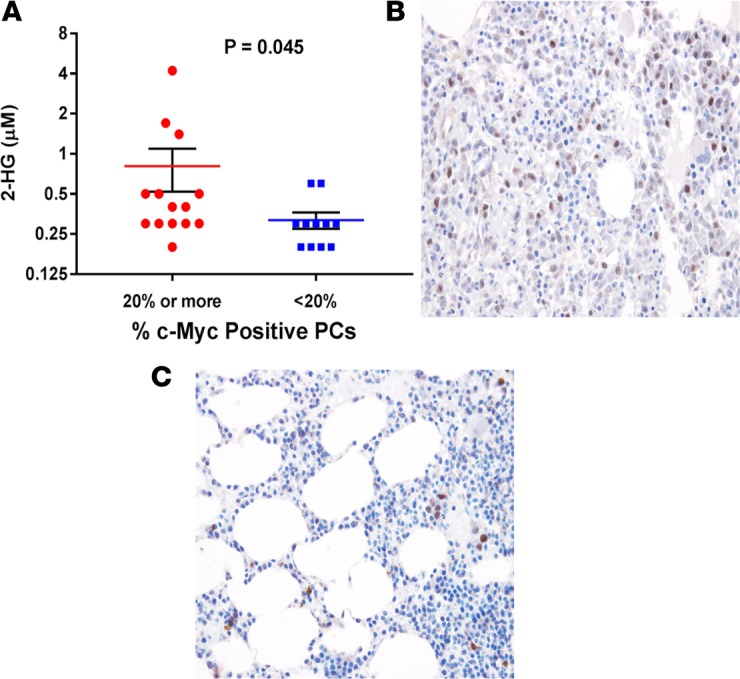
Figure 8. c-Myc expression in BM plasma cells correlates with 2-HG levels in the BM supernatant.

(A) Dot plot graph depicting the individual (red circles and blue squares), mean (red and blue line), and ± SEM (black error bars) of 2-hydroxyglutarate (2-HG) concentrations in the BM supernatant of patients with smoldering multiple myeloma (SMM) whose BM biopsies show either ≥ 20% (n = 14) or < 20% (n = 11) clonal plasma cells with c-MYC nuclear staining. Comparisons were made by the Mann-Whitney test, and significance was defined as P < 0.05. (B) Example of a BM biopsy (magnification 40×) showing ≥ 20% clonal plasma cells with c-MYC nuclear staining (brown). (C) Example of a BM biopsy (magnification 40×) showing <20% clonal plasma cells with c-MYC nuclear staining (brown).
