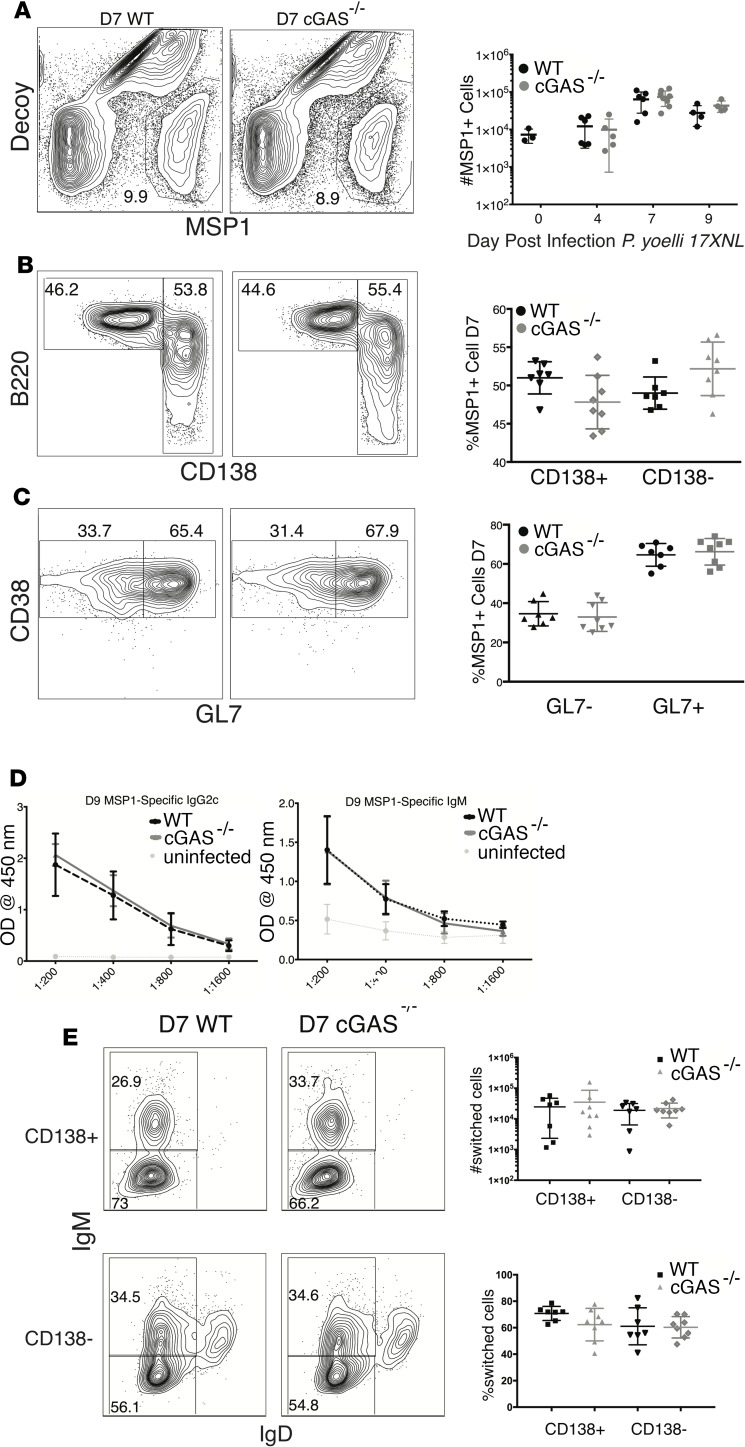
Figure 4. Absence of cGAS does not affect early activation or expansion of malaria-specific B cells or production of malaria-specific class-switched antibodies.
(A) Flow cytometry gating scheme to quantify antigen-experienced MSP1+ B cells enriched from spleen and lymph nodes on days 4, 7, and 9 after infection. Antigen-experienced B cells were identified as singlets, Thy 1.2–, CD138+, and/or B220+, MSP1+ tetramer+ cells. Error bars represent SD. (B) Representative plots of CD138+ and CD138–MSP1+ B cells shown in A. There were no statistical differences between the frequencies of CD138+ or CD138– B cells in experimental versus control mice. (C) GL7 by CD38 staining on CD138– cells after infection. Cells were gated as singlets, Thy 1.2–, decoy–, MSP1+, CD138– cells. Error bars represent SD. (D) IgM and IgG MSP-specific antibody titers 9 days after infection. The average titer from 11 mice pooled from 3 experiments is shown. Error bars represent SD. Statistical analysis was performed using the unpaired Student’s t test. (E) Representative plots demonstrating the isotype of MSP1+ B cells. Plots representative of 3 experiments are shown.

