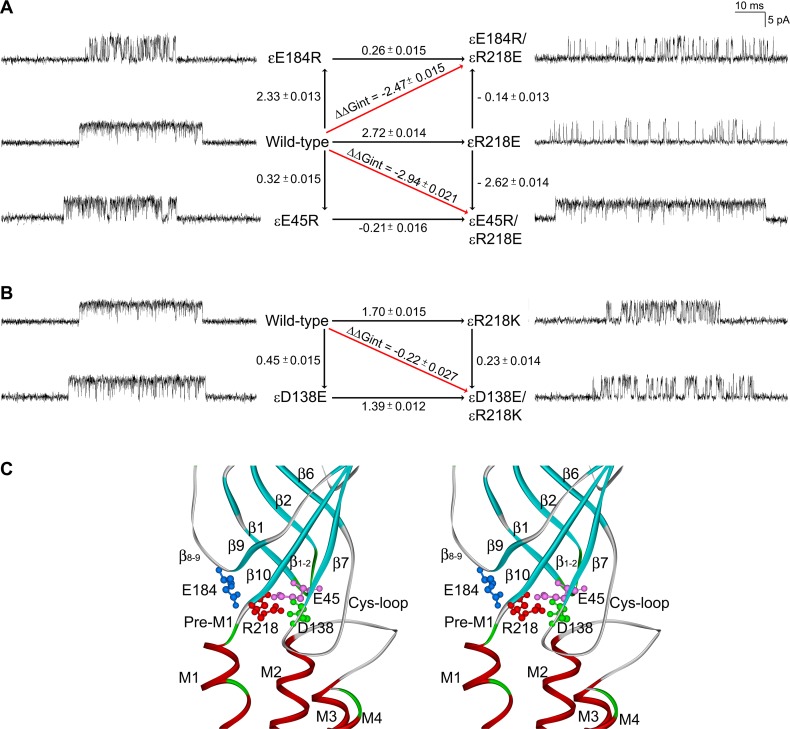
Figure 3. Mutant cycle analysis.
(A) A mutant cycle of energetic interaction among εE184 and εR218 and among εE45 and εR218. Single-channel currents correspond to each species of acetylcholine receptor (AChR) elicited by 300 μM acetylcholine (ACh). Numbers over the arrows indicate the difference in the apparent gating free energy between 2 different AChRs in kcal/mol. The standard error (SE) values were computed as described under Methods. The 95% confidence limit, or twice the SE, indicates a coupling energy significantly different from zero. The indicated diagonal arrows show the coupling free energy (ΔΔGint) for εE184R/εR218E and εE45R/εR218E. (B) A mutant cycle of energetic interaction among εD138 and εR218. (C) Stereo view of the interface between extracellular domains and transmembrane domains shows spatial disposition of interactions of Arg218 in pre-M1 with Glu184 in the β8-9 loop revealed by mutant cycle analysis in the current work, with Glu45 in the β1-2 loop and with Asp138 in the Cys-loop proposed in the Discussion.

