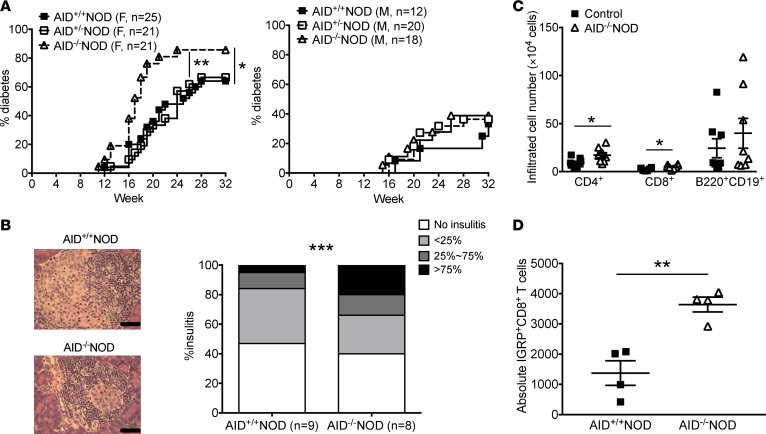
Figure 1. AID deficiency promotes the development of T1D in NOD mice.
(A) Diabetes incidence in AID–/–NOD mice and their AID+/–NOD and AID+/+NOD littermates. Data were pooled from 3 independent experiments. n = 21–25 mice/female group and n = 12–20 mice/male group. (B) Insulitis in 8-week-old nondiabetic female AID–/–NOD and AID+/+NOD mice. At least 100 islets were examined from 8–9 mice/group. Scale bars: 50 μm. (C) Summary of the absolute cell number of infiltrating CD4+ T cells, CD8+ T cells, and B220+CD19+ B cells in the islets of 10- to 12 week-old female AID–/–NOD and control NOD mice (mixed AID+/–NOD and AID+/+NOD). Data are expressed as mean ± SEM and were pooled from 2 independent experiments. (D) Absolute IGRP+CD8+ T cells. Islet infiltrates from 10- to 12 week-old female AID–/–NOD and control mice were stained with IGRP-tetramer, CD45, CD8, and TCRβ followed with FACS analysis. n = 4 mice/group. *P < 0.05; **P < 0.01; ***P < 0.001, Gehan-Breslow-Wilcoxon survival test (A), χ2 test (B), and Student’s t test (C and D).

