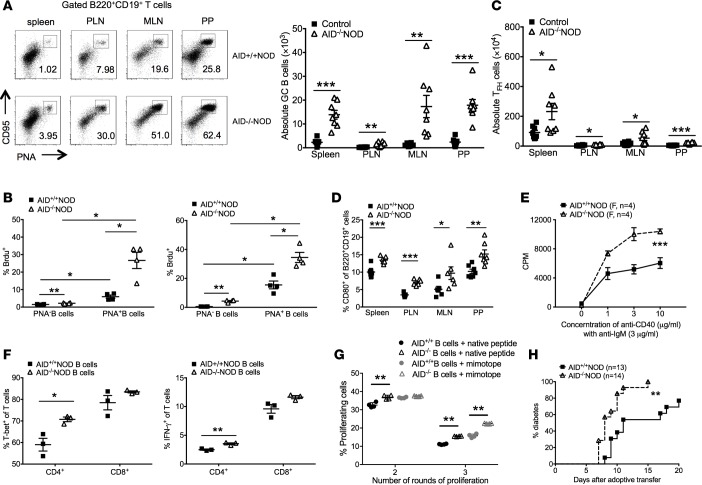
Figure 5. Enhanced B cell activation and B-T cell interaction and increased B cell pathogenicity in AID–/–NOD mice.
8- to 10 week-old female AID–/–NOD and control mice were used for A–F. (A) FACS plots of CD95 and PNA coexpression in B cells and summary of total GC B cells of spleen, PLN, MLN, and PP. n = 8 mice/group. (B) BrdU incorporation in PNA+ B cells from spleen and PLNs. (C) Summary of total Tfh cells (PD-1+CXCR5+CD4+TCRβ+) from spleen, PLN, MLN, and PP. n = 8 mice/group. (D) CD80 expression in gated B220+CD19+ B cells. n = 8 mice/group. (E) Cell proliferation of sorted splenic B cells (5 × 10⁴ cells/well) from female AID–/–NOD and AID+/+NOD mice, cultured with anti-IgM (3 μg/ml) and different concentrations of anti-CD40 for 4 days. (F) T-bet and IFN-γ –expressing T cells. Purified splenic B cells (2 × 10⁶ cells/well) were cocultured with purified NOD splenic CD4+ or CD8+ T cells (T/B = 1:1) with anti-CD3 antibody (1:300 dilution) for 4 days. Cells were then stained for IFN-γ and T-bet, analyzed by FACS. (G) Purified splenic B cells (106 /ml) from AID–/– or AID+/+NOD mice were cocultured with CFSE-labeled CD4+ T cells (106 /ml) from BDC2.5 NOD mice in the presence of native hybrid peptide (insulin/ChgA) or mimotope(10 ng/ml). Dilution (number of round of proliferation) of BDC2.5 CD4+ T cells was examined. The difference in percentage of proliferating BDC2.5 T cells in the second or third peaks of proliferation was compared. **P < 0.01, multiple t tests with FDR correction. (H) Purified splenic B cells (5 × 10⁶ ) were cotransferred with 3 × 10⁶ purified BDC-2.5 CD4+ T cells into Rag2–/–NOD or NOD.scid mice (4–5 weeks old), followed by observation for diabetes development. Data were pooled from at least 2 independent experiments (A, C, D, and G) or 1 of over 3 individual experiments (B, E, and F). *P < 0.05; **P < 0.01; ***P < 0.001, multiple testing with Bonferroni correction (A, D, and F), 2-tailed Student’s t test (B and C), 2-way ANOVA (E), and Gehan-Breslow-Wilcoxon survival test (G). Data are shown as mean ± SEM.

