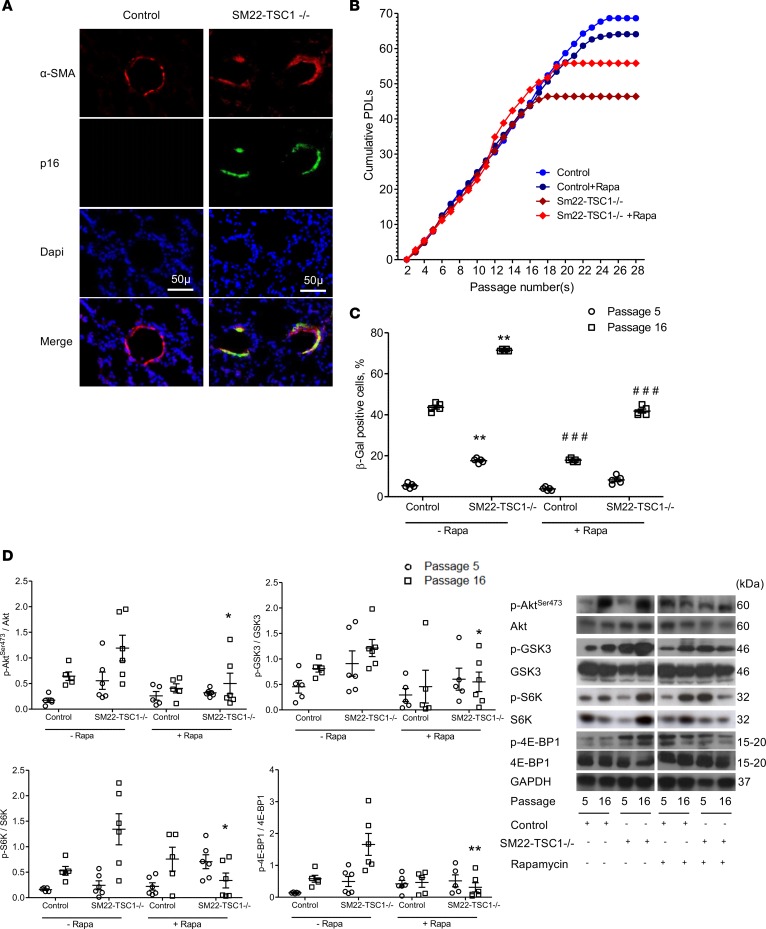
Figure 5. Characteristics of PA-SMCs from SM22-TSC1–/– mice.
(A) Photomicrographs of pulmonary vessel walls showing p16-positive cells also stained for α-smooth muscle actin (α-SMA) in SM22-TSC1–/– mice compared with control mice. Scale bars: 50 μm. (B) Replicative senescence of PA-SMCs from SM22-TSC1–/– and control mice treated by rapamycin or vehicle (n = 5–6 in each group). Cells were subjected to repeated passages and counted at each passage, and the population doubling level (PDL) was calculated. (C) Percentage of β-galactosidase–positive (β-Gal–positive) PA-SMCs from SM22-TSC1–/– and control mice at passages 5 and 16. Data are mean ± SEM. **P < 0.01 vs. controls at the corresponding cell passage, ###P < 0.001 compared with vehicle-treated cells at the corresponding cell passage, by 2-way ANOVA. (D) Representative Western blots and graphs of protein levels of Akt phosphorylated at Ser473 (Akt-Ser473), glycogen synthase kinase 3 (GSK3), S6 kinase (S6K), and 4E-binding protein 1 (4E-BP1) in PA-SMCs from SM22-TSC1–/– and control mice at passages 5 and 16, during treatment with either vehicle or rapamycin. Values are mean ± SEM. *P < 0.05, **P < 0.01 compared with vehicle-treated cells at the corresponding cell passage (analysis by 2-way ANOVA with Bonferroni posthoc test).

