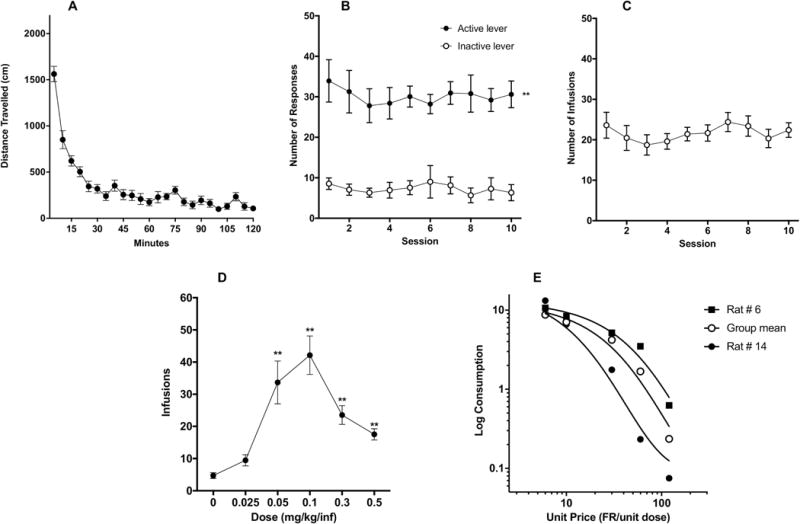
Figure 1.

(A) Mean (± SEM) distance traveled in 5-minute blocks during locomotor testing. Mean (± SEM) number of response on the active and inactive levers (B) and infusions per session (C) during acquisition in Experiment 1. (D) Mean (± SEM) number of infusions at each morphine SA unit dose during demand testing. (E) Exponential demand curve describing morphine consumption as a function of unit price for rats as a group. Demand curves for individual rats with relatively low (rat #6) and high (rat #14) elasticity of demand are also shown.
