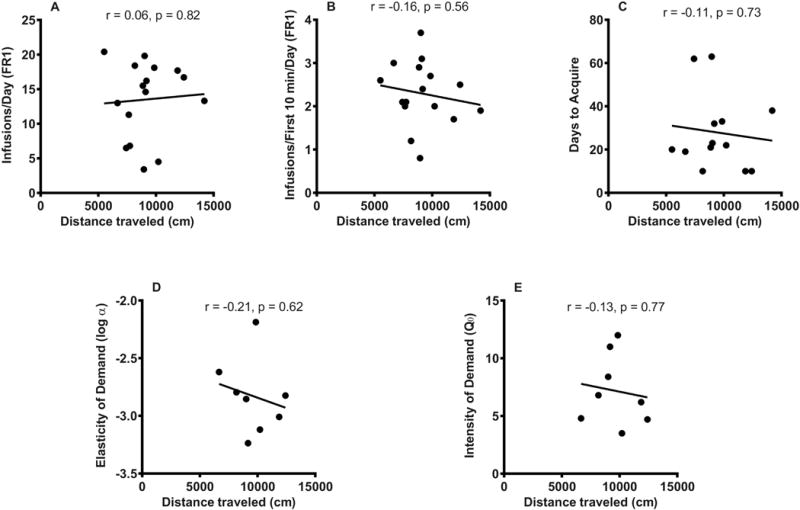
Figure 4.

Relationship between distance traveled during the 2 hour locomotor activity test and (A) mean daily infusions during the first 10 sessions of acquisition, (B) mean daily infusions during the first 10 minutes of each session during the first 10 acquisition sessions, (C) number of days to acquire; (D) elasticity of demand (log α), and (E) intensity of demand (Q0) in the morphine SA group. There are fewer data points for (C-E) than in (A) and (B) due to attrition (see text).
