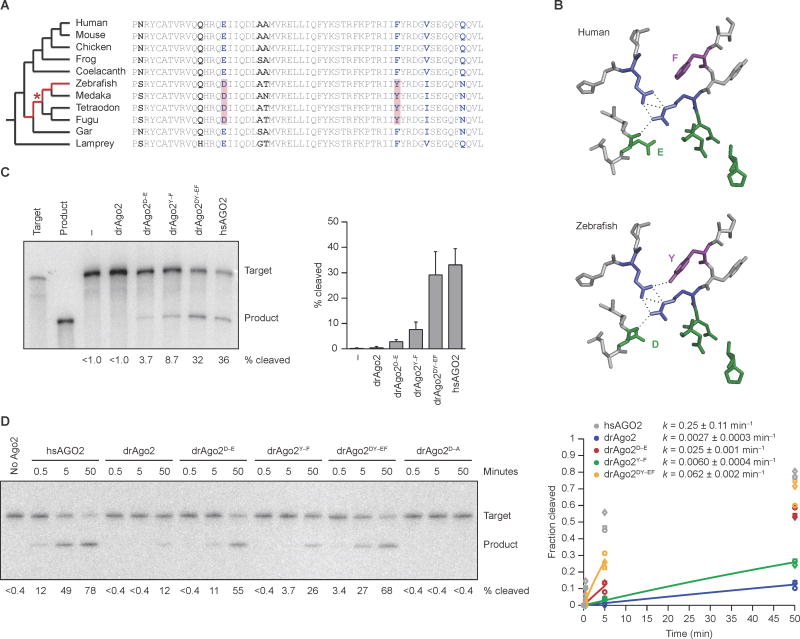
Figure 2. Two Point Substitutions that Explain the Ineffective Slicing by drAgo2.
(A) Comparative analysis of drAgo2 and its orthologs in 10 other vertebrate species. The cladogram shows the evolutionary relationships between the species (left), and the sequence alignment highlights differences within a short region of the Ago2 PIWI domain (right). Segments of the jawed-fish lineage originally under consideration for the loss of drAgo2 slicing activity are highlighted (red) in the cladogram. All residues that vary among these species are in bold, and those identical in Sarcopterygii and lamprey but different in zebrafish are in blue. The two substitutions that were the primary candidates for conferring the loss of slicing are shaded in red in the alignment, with the most parsimonious timing of their occurrence indicated with a red asterisk in the cladogram.
(B) Structure of the Ago2 active-site residues and selected neighboring residues, modeling the amino acid changes (E-to-D and F-to-Y) that explain the loss of efficient slicing in zebrafish. Residues were modeled within the context of the hsAGO2 structure (Schirle and MacRae, 2012), substituting the ancestral residues of the human protein (top) with those of zebrafish (bottom). The residues of the catalytic tetrad, including the active-site E that changes to a D, are in green. Also shown is part of the hydrogen-bond network (dashed lines) that positions the E of the ancestral active-site and involves residues shown in blue (Nakanishi et al., 2012). The co-varying F-to-Y residue is in purple, with a potential additional hydrogen bond also shown, which might perturb the hydrogen-bond network in zebrafish.
(C) The effect of restoring the ancestral residues on the slicing activity of drAgo2 in zebrafish embryos. Otherwise, this panel is as in Figure 1B. The graph plots mean values from three experiments (error bars, standard deviation).
(D) The effect of restoring the ancestral residues on the slicing activity of drAgo2 in vitro. Below each lane is the percentage of target converted to product, reporting the mean from three experiments. Otherwise, this panel is as in Figure 1D. Results for hsAGO2 (grey), drAgo2 (blue), drAgo2D–E (red), drAgo2Y–F (green), and drAgo2DY–EF (orange) are shown for three replicates (circle, squares, and triangles). The line for each substrate represents the best fit of the mean values to an exponential reaction course (considering only values in which less than half of the substrate had reacted), which generated the rate constants (k, shown ± 95% confidence intervals).
See also Figure S2 and S3.

