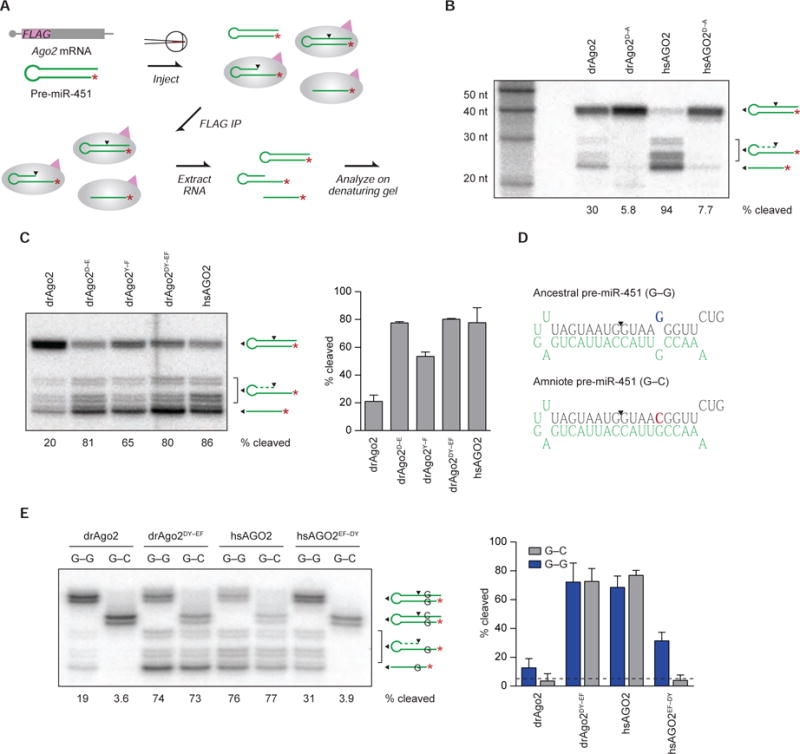
Figure 3. A G–G Mismatch that Promotes Maturation of Fish Pre-miR-451.

(A) Schematic of the in vivo assay for pre-miR-451 binding and cleavage. End-labeled (red asterisk) pre-miR-451 and mRNA encoding a FLAG-tagged Ago2 protein are co-injected into zebrafish embryos at the one-cell stage. As the embryo develops, some pre-miR-451 is loaded into tagged Ago2 and cleaved at the site indicated (arrowhead), and some cleaved RNA is further resected to generate mature miR-451. At 4 hpf, embryos are lysed, and Ago protein translated from the injected mRNA is immunoprecipitated (IP) based on affinity to the 3X-FLAG tag (pink triangle). Co-immunoprecipitating RNAs, including loaded pre-miR-451, mature miR-451, and processing intermediates, are isolated and analyzed on a denaturing gel.
(B) The ability of the zebrafish and human proteins to cleave pre-miR-451 in zebrafish embryos. Shown are results of binding-and-cleavage assays for the indicated proteins and their respective catalytically dead variants (D-to-A mutants). Each lane contained RNA co-immunoprecipitated from approximately 300 embryos. Below each lane is the percentage of the loaded pre-miR-451 that was cleaved (calculated using all cleaved species, including fully and incompletely resected cleavage products).
(C) The effects of restoring the ancestral residues to drAgo2 on pre-miR-451 binding and cleavage. Assays were as in (B), injecting mRNA for the indicated proteins. The graph plots mean values from two experiments (error bars, range).
(D) The ancestral and amniote pre-miR-451 sequences, indicating residues of the mature miR-451 guide RNA (green), the site of Ago2-catalyzed cleavage (arrowhead), and the G-to-C change (blue and red, respectively) that creates a G–C match with miRNA position 6.
(E) The effects of the position-6 G–C match on pre-miR-451 binding and cleavage. Assays were as in (B), co-injecting mRNA for the indicated Ago2 proteins with either end-labeled ancestral (G–G) or amniote (G–C) pre-miR-451. The graph plots mean values from two experiments (error bars, range), with the background level of activity indicated (dashed line), as determined from the cleavage observed for the active-site mutants in (B).
See also Figure S4 and S5.
