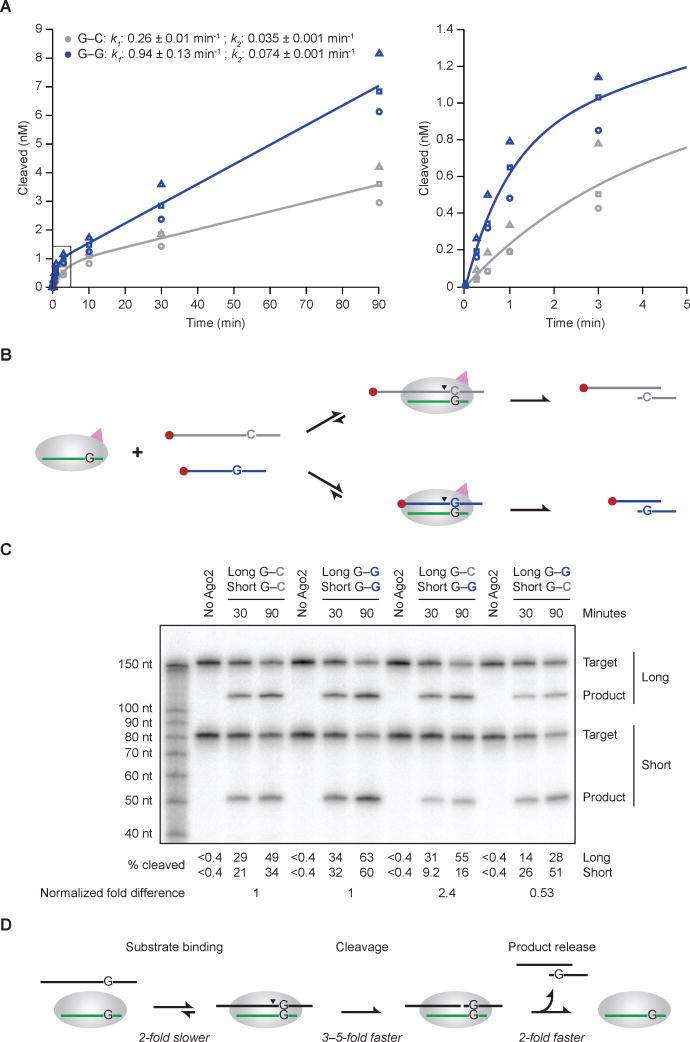
Figure 5. Effects of the G–G Mismatch on Target Association, Slicing, and Product Release.
(A) The effect of a position-6 G–G mismatch on multiple-turnover slicing by hsAGO2. These in vitro assays were as in Figure 4A, except substrate (5 nM) was in excess over AGO2 (0.5 nM). Results for the G–C matched (grey) and G–G mismatched (blue) substrates are shown, distinguishing the three replicates (circles, squares, triangles). The graph on the right shows results for the earliest time points (boxed in the graph on the left). The line for each substrate represents the best fit of the mean values to a biphasic reaction course (Wee et al., 2012), which generated the initial and steady-state rate constants (k1 and k2, respectively, shown ± 95% confidence intervals).
(B) Schematic of the in vitro competitive binding and cleavage assay with long (168-nt) and short (80-nt) cap-labeled miR-430 targets.
(C) The effect of the G–G mismatch on competitive binding and cleavage. These in vitro assays were as in Figure 5A, with substrates (2.5 nM each) in excess over hsAGO2 (0.5 nM). The percent of long and short substrates cleaved is shown below the gel. For each substrate pair, the fold difference observed between long and short substrates was normalized using the data from the left half of the gel to account for the differences observed for the same site in the long and short contexts, and these normalized fold differences are shown at the bottom.
(D) Minimal kinetic scheme for Ago2-catalyzed slicing, annotating for each step the effect of the position-6 G–G mismatch compared to the G–C match.
See also Figure S7.

