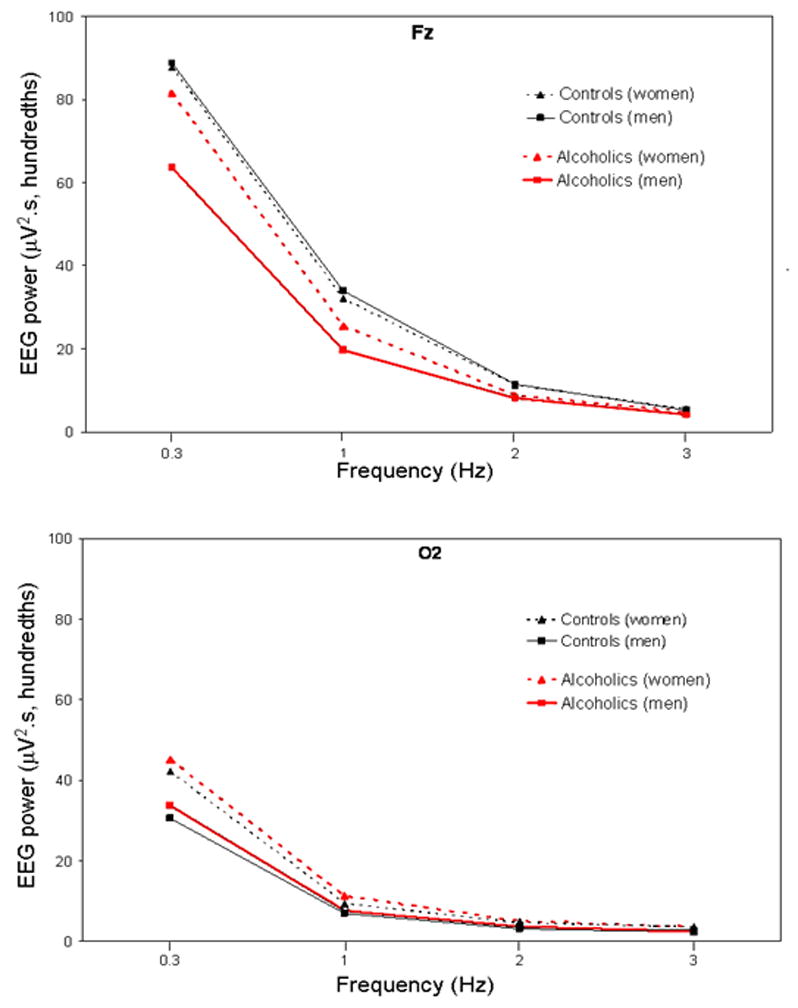
Figure 3.

Figure 1: All-night NREM sleep slow wave activity (; 0.3 – <4 Hz) at Fz (upper panel) and O2 (lower panel) for 34 alcoholics (21 men) and 41 controls (18 men). Values are averaged within the 0.3–1 Hz bin, and within each 1-Hz frequency bin thereafter. Bins are identified by their lower boundary. Data are dawn from (Colrain, Turlington, and Baker 2009b).
