
FIGURE 1. Bloch-McConnell and Lorentzian line shape fitting methods for acidoCEST MRI.
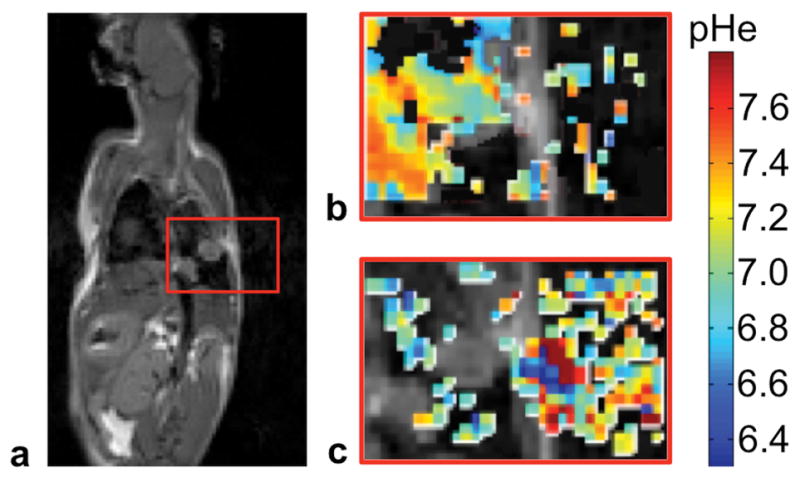
a) The anatomical image shows the location of the lung tumor. The red box indicates the regions shown in panels b and c. Parametric maps of tissue pHe from acidoCEST MRI fit with b) the Bloch-McConnell equations modified to include pH as a fitting parameter, and c) Lorentzian line shape fitting show that Bloch fitting estimated pHe values primarily in tissue regions, while Lorentzian fitting estimated pHe values primarily in air regions.