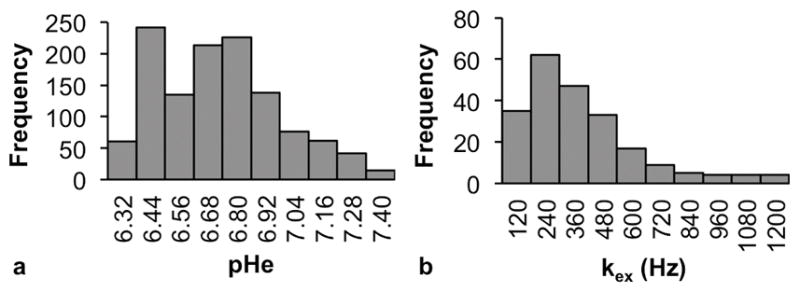
FIGURE 5.

Histograms showing the data distributions of (a) pHe and (b) kex in all three tissue types combined. In (a) the range of possible pHe values (6.2 – 7.4) was divided into 10 equal bins. In (b), five outliers ( > 1400 Hz) were excluded, and the remaining kex values, ranging from (0 – 1200 Hz) were divided into 10 equal bins.
