Fig. 1.
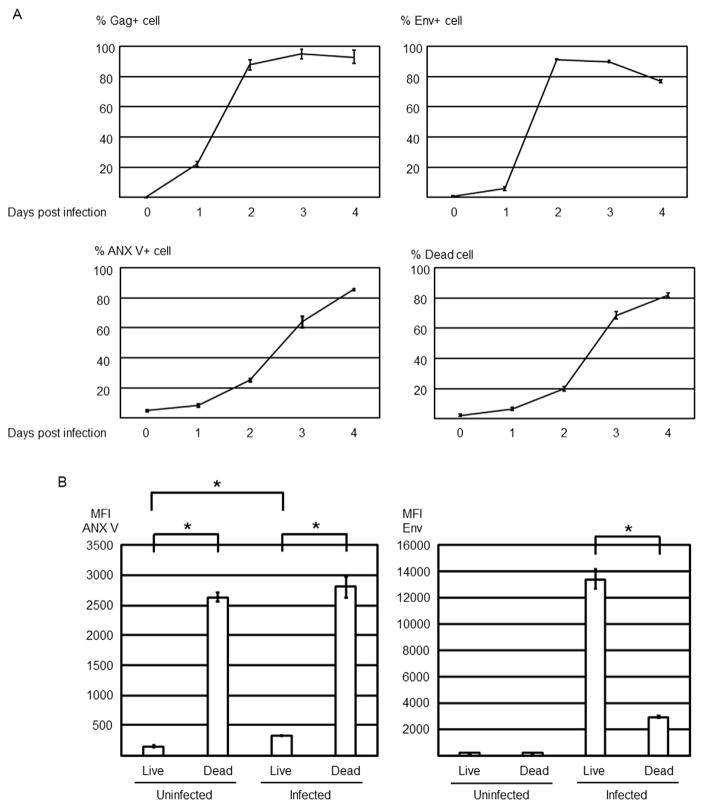
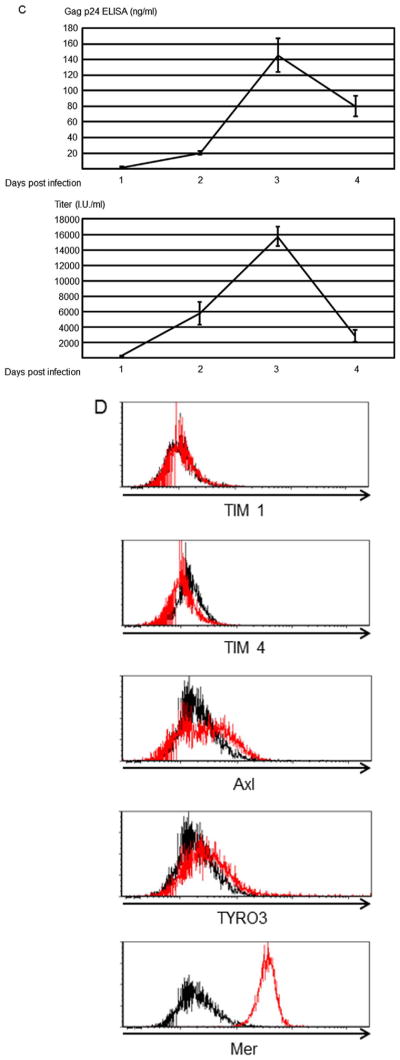
HIV-1 infection induces PtdSer exposure. MT4CCR5 cells were infected with HIV-1NL4-3 at MOI 5. Infected cells were analyzed by flow cytometry for expression of Gag and Env, exposure of PtdSer, and cell death, and virus production was quantified by ELISA and titration for up to four days post-infection. This experiment was repeated twice in singlicate and once in triplicate as independent experiments (A–C). The results shown are averages and standard deviations of the triplicate experiment. (A) HIV-1 Gag expression was quantitated by intracellular staining of cells with FITC-conjugated anti-HIV-1 p24 antibody. Env expression and cell death were quantitated by staining with Alexa 647-conjugated anti-HIV-1 gp120 antibody and Ghost Dye Violet 450. PtdSer exposure and cell death were quantitated by staining with APC-conjugated ANX V and Ghost Dye Violet 450. (B) Mean fluorescence intensity of ANX V and Env staining of live and dead populations of uninfected and infected cells. The infected cells were analyzed at 3 days post-infection. (C) Supernatants of infected cells were harvested every 24 h after infection for 4 days, and virus production was quantitated by measuring amounts of Gag by ELISA and titration of virus, using GHOST (3) CXCR4+CCR5+ cells. (D) Expression levels of TIM-1, TIM-4, Axl, TYRO3, and Mer were analyzed by staining cells with specific PE-conjugated antibodies against each molecule (red lines). The black line represents staining with PE-conjugated isotype control antibody.


