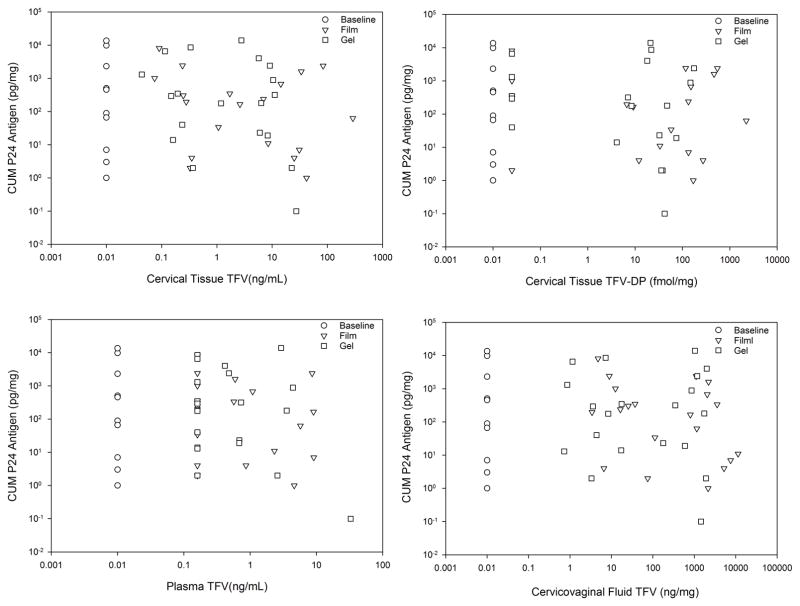
Figure 4.
Cumulative P24 Antigen v. TFV Concentration across all matrices by product. Regression lines are not shown since no linear regression fitting demonstrated statistically significant slopes (none different from slope=0). Baseline values arbitrarily imputed as 0.01 units in each panel. Concentration values below the lower limit of assay quantitation (LLOQ) calculated for each individual sample are imputed as LLOQ/2 for the median calculated LLOQ.

