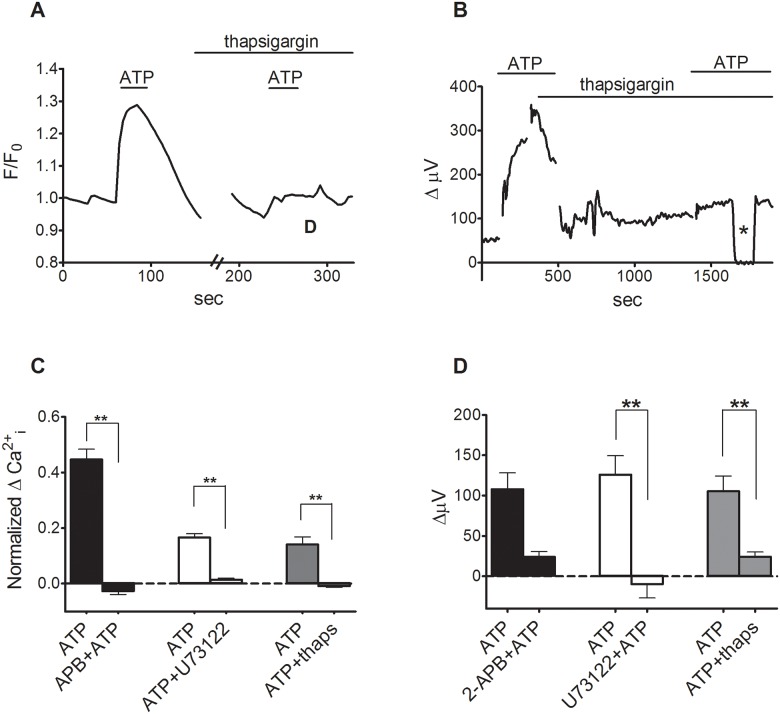
Fig 3. ATP-induced changes in intracellular calcium and extracellular H+ flux.
(A) 1 μM ATP increased intracellular calcium as reported by changes in the fluorescence of the calcium indicator Oregon Green. Subsequent ATP-induced alterations in Oregon Green fluorescence were blocked by 1 μM thapsigargin applied for 15 minutes. (B) A representative single self-referencing recording from an isolated Müller cell demonstrating that thapsigargin also reduced the increase in H+ flux induced by 1 μM ATP from Müller cells; asterisk: background control. (C) Mean responses from imaging data for ATP induced responses in 2-APB, U73122 and thapsigargin. Data was normalized to the last fluorescence data point before treatment. (D) Mean responses with self-referencing. ATP readings represent absolute recorded values minus values of the standing flux.

