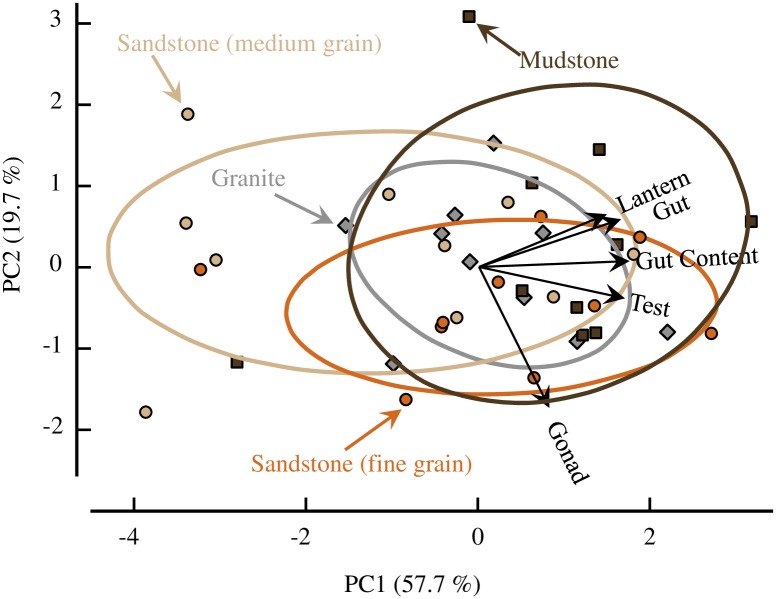
Fig 4. Principal component analysis.
The first two principal components accounted for 77.4% of the variation. The four treatments (n = 10) are distinguished by different colored symbols which match the colors of the 68% confidence ellipses for each group: sandstone = circles (tan = medium-grain, orange = fine-grain); mudstone = brown squares; granite = gray diamonds. Vectors of loadings for the five different body components are also plotted (black arrows).

