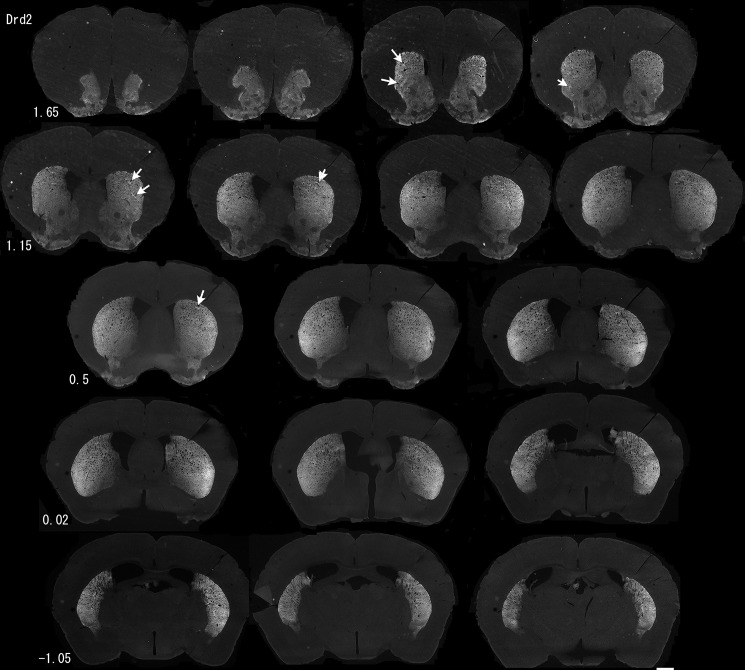
Fig 14. Gradient in Drd2 immunoreactivity through the striatum.
Sections were taken at 160 μm intervals and numbers indicate the approximate location of the section relative to bregma. Arrows indicate examples of regions of increased immunoreactivity in rostral striosomes. Images were taken with the Axiozoom microscope.

