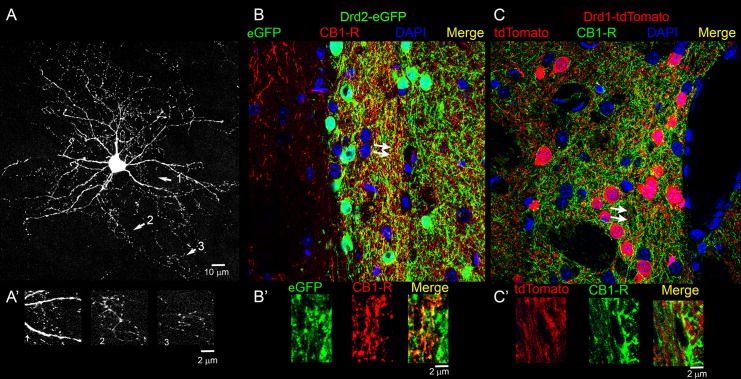
Fig 16. Projection images of CB1-R immunoreactivity in the Drd1-tdTomato and the Drd2-eGFP lines.
(A) A representative tdTomato-filled MSN shown for axon scale. Areas indicated by arrows are shown magnified (A’) to demonstrate the size of the axons relative to the dendrites (scale bar in A’ is 2 μm). (B) CB1-R (red) and Drd2-eGFP (green) immunoreactivity in striatum. (C) CB1-R (green) and Drd1-tdTomato (red) immunoreactivity in striatum. Arrows indicate areas where single optical sections were expanded for B’ and C’. Yellow indicates colocalization and DAPI (blue) is used to define all nuclei in each strain. Scale bar in B is 10 μm and applies to C. Scale bar in B’, C’ is 2 μm. Images were taken with the LSM880.

