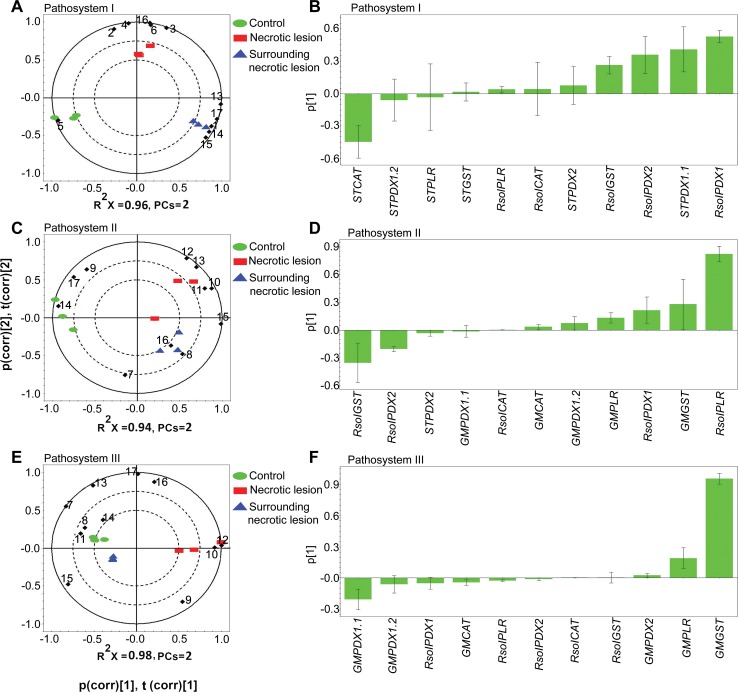
Fig 3.
Principal component analysis (PCA) loading biplots for the effect of 11 antioxidant genes relative transcript abundance on control, infected and surrounding tissues in (A) pathosystem I, (C) pathosystem II, and (E) pathosystem III (P< 0.05). Principal component analysis (PCA) loading coefficient plots for the effect of 11 antioxidant genes relative transcript abundance on control, infected and surrounding tissues in (B) pathosystem I, (D) pathosystem II, and (F) pathosystem III. The scaled loading vectors pc (corr) and t (corr) are displayed for the first and the second component. Outer ellipses represent the Hotelling’s T2 at a 95% confidence interval. R2X represents the fraction of the sum of squares of the two principal components. ST: Solanum tuberosum, GM: Glycine max. Diamond represents genes. 1 = STPDX1.1, 2 = STPDX1.2, 3 = STPDX2, 4 = STPLR, 5 = STCAT, 6 = STGST, 7 = GMPDX1.1, 8 = GMPDX1.2, 9 = GMPDX2, 10 = GMPLR, 11 = GMCAT,12 = GMGST, 13 = RsolPDX1, 14 = RsolPDX2, 15 = RsolPLR, 16 = RsolCAT,17 = RsolGST.

