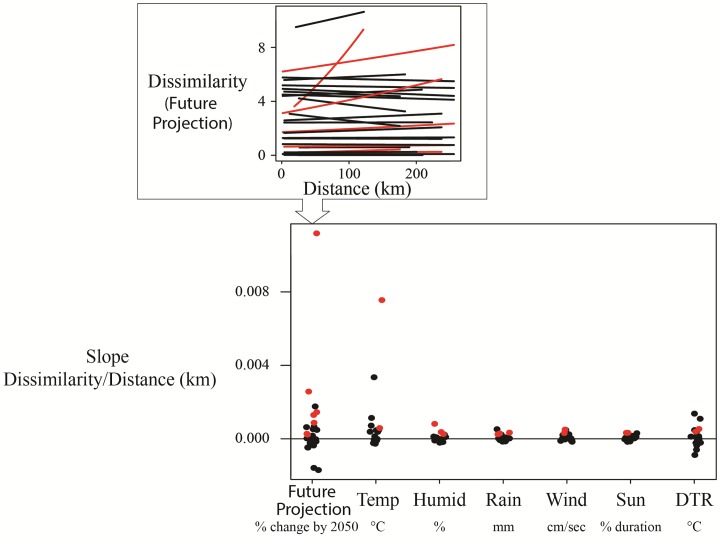
Fig 8. The distribution across species of relationships between distance (km) and dissimilarity in sites sensitivities and future projections.
The top figure illustrates how the slopes were estimated in the lower figure (the y-axis). In the top figure, we specifically show the relationship between dissimilarity and distance (km) for future projections, where each line represents a different species. A slope of 0 would mean that projections did not differ with distance, while a positive slope would indicate that closer sites were more similar. The red slopes indicate when a slope was positive and their 95% CI did not cross zero. The bottom figure summarises the slope estimates for each species for future projections and climate sensitivity for each of the six specific climate variables. There were 7 species that showed a significant increase for future projections, 3 species were sensitive to rain, and 2 were sensitive to all other climate variables.

