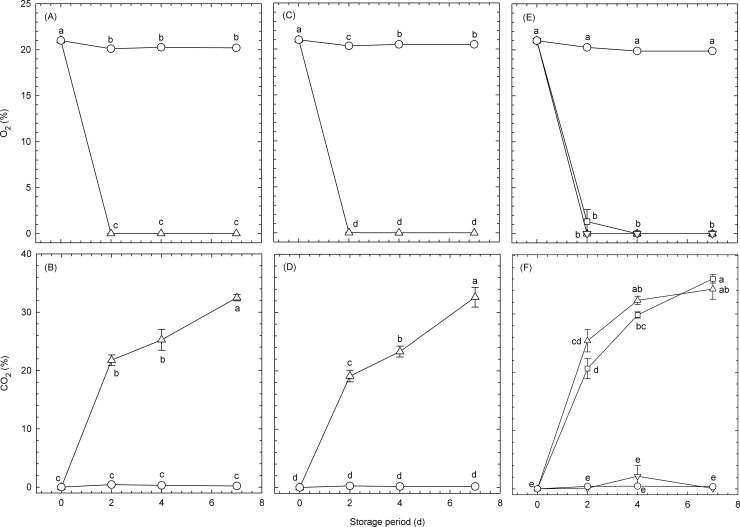
Fig 1.
Temporal changes in [(A), (C), and (E)] O2 and [(B), (D), and (F)] CO2 concentrations inside plastic pouches containing broccoli florets and maintained at 20°C. Data for (A) and (B), (C) and (D), and (E) and (F) were obtained from Experiment #1, Experiment #2, and Experiment #3, respectively (Table 1). Circles: micro-perforated pouches with O2 transmission rates of 1.2 × 10⁶ mL m−2 d−1 atm−1 (normoxia); upward-pointing triangles: high-barrier pouches with O2 transmission rates of 8.0 mL m−2 d−1 atm−1 (hypoxia); downward-pointing triangles: high-barrier pouches with O2 transmission rates of 8.0 mL m−2 d−1 atm−1 and including CO2 absorbers; squares (hypoxia): micro-perforated pouches with O2 transmission rates of 64.0 mL m−2 d−1 atm−1 (hypoxia). Values are the means ± SE of three observations from three different biological samples. Symbols followed by the same letter within the same figure indicate that there were no significant differences (p < 0.05, Tukey’s honest difference test).

