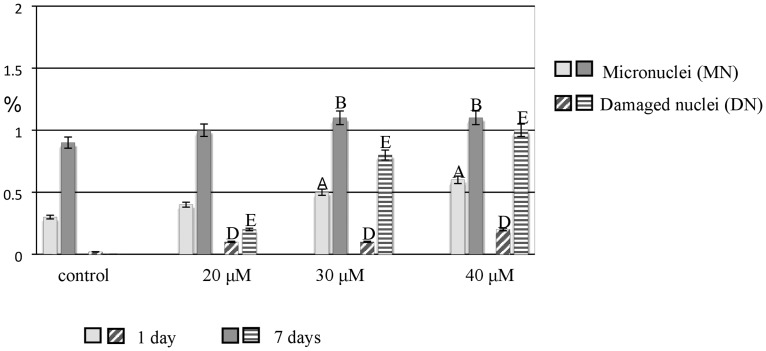
Fig 8. The frequency of root cells of barley cv. ‘Sebastian’ with micronuclei and damaged nuclei in control and after Al treatment.
The error bars represent the standard deviations of the mean. The significant differences (P < 0.05) between the treated combinations and the control within the same treatment day are indicated by capital letters: A, B, D, E.

