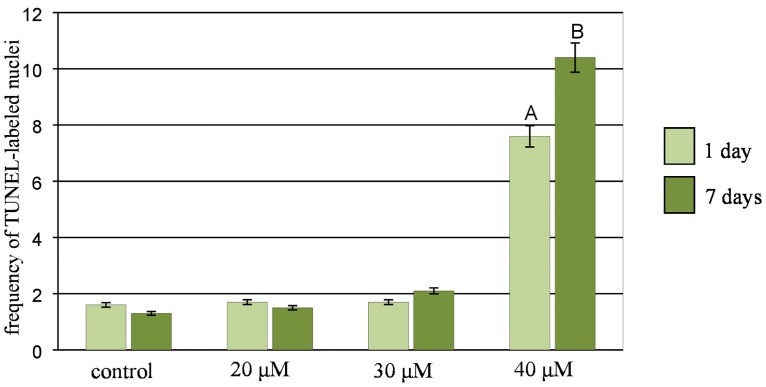
Fig 10. The frequency of labelled nuclei in root cells of barley cv. ‘Sebastian’ in TUNEL test in control and after Al treatment.
The error bars represent the standard deviations of the mean. The significant differences (P < 0.05) between the treated combinations and the control within the same treatment day are indicated by a capital letter A (1-day treatment) or B (7-day treatment).

