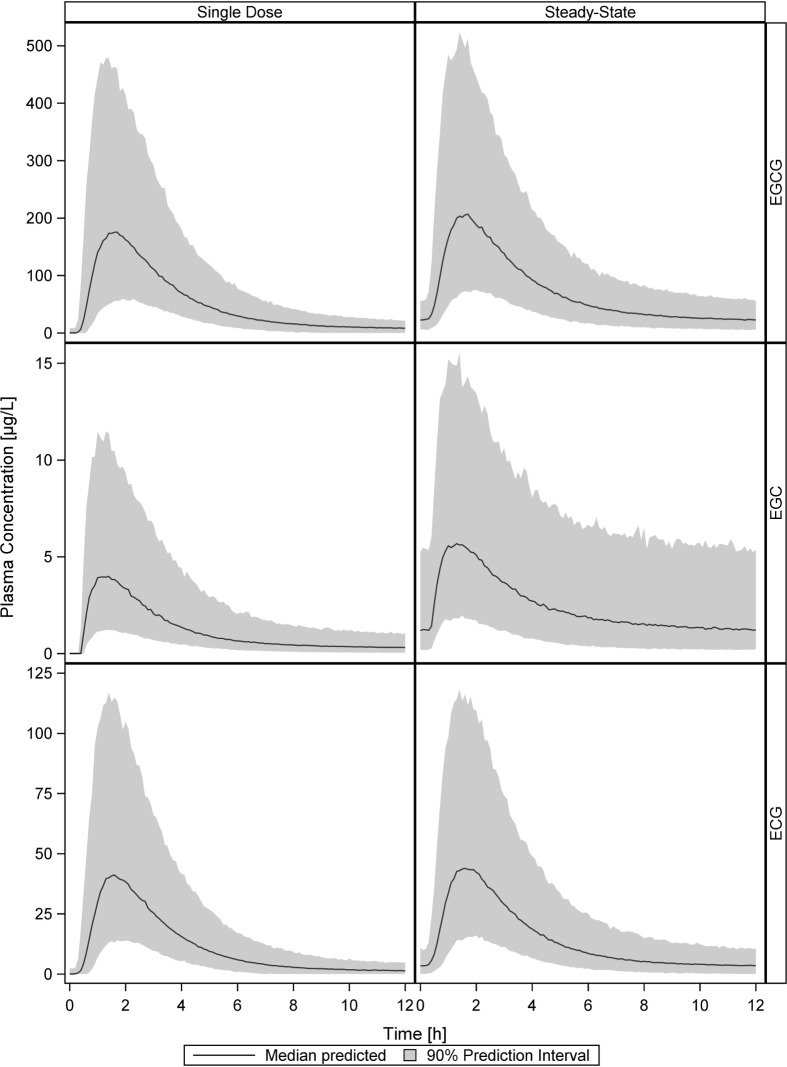
Fig 8. Simulation of single dose and steady-state plasma concentrations using the final PopPK model parameters of EGCG, EGC and ECG.
Shown are the predicted medians (black lines) and corresponding 90% prediction intervals (shaded grey areas) of the simulation of 1000 individual plasma concentration-time profiles for each green tea catechin.

