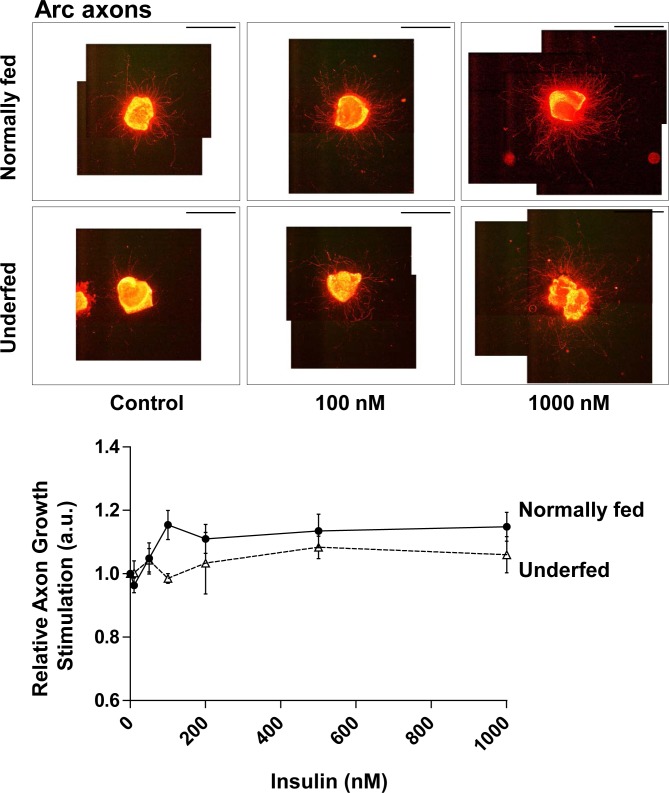
Fig 2. Response of arcuate neurons to insulin.
Relative axonal growth in 24 h in whole arcuate neuron explants in the presence of various molar concentrations of insulin (0, 10, 50, 100, 200, 500 nM, and 1μM) was measured by immunohistochemistry against neurofilaments (NF). Arcuate explants were harvested from normally fed (dark circles and plain line) (n = 3–4) or underfed pups (open triangles and dotted line) (n = 6). Illustrative images of explants are presented above the graph for control (0 nM), 100 nM and 1000 nM of insulin. Scale bar indicates 2000 μm. Data are presented as the mean ± SEM. Results were analyzed by two-way ANOVA (see text) with a Bonferroni correction for multiple comparisons. The precise molar concentrations-response effect within each group was further analyzed by one-way ANOVA with a Newman-Keuls multiple comparison test. The results of all comparisons were non-significant.

