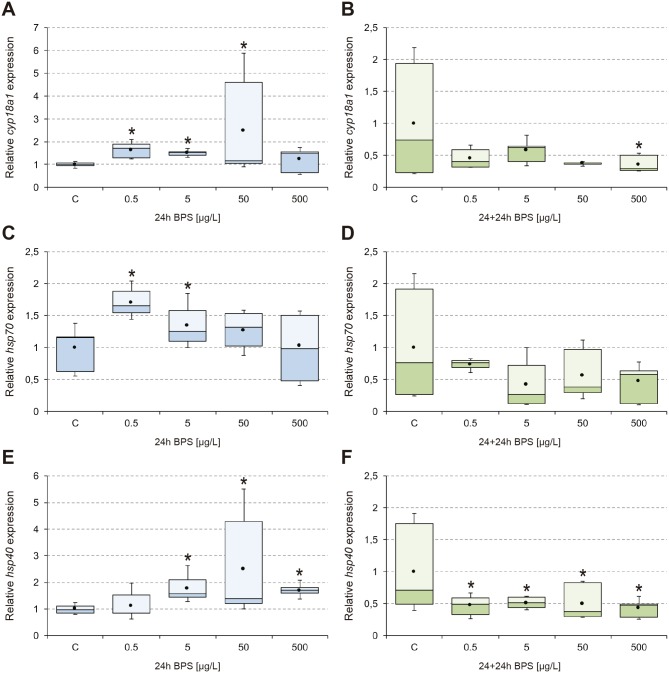
Fig 2. Transcriptional activity of cyp18a1, hsp70, and hsp40.
Box-and-whisker plots represent the expression patterns of cyp18a1 (A-B), hsp70 (C-D), and hsp40 (E-F), measured by real-time RT-PCR. C. riparius fourth instar larvae were exposed to 0.5–500 μg/L BPS for 24 h (24h; left column; blue series), and maintained for an additional 24 h in fresh culture medium after BPS withdrawal (24+24h; right column; green series). Four independent experiments were performed and RNA was extracted from 5 larvae for each experimental condition (n = 20). Results were normalized to control values. Box and whiskers represent the 25–75 percentile and the minimum/maximum measured values; the mean is represented by a dot; the horizontal line separating the lower (dark) and the upper (light) area represents the median. Asterisks (*) indicate significant differences (p ≤ 0.05) with respect to control values.

