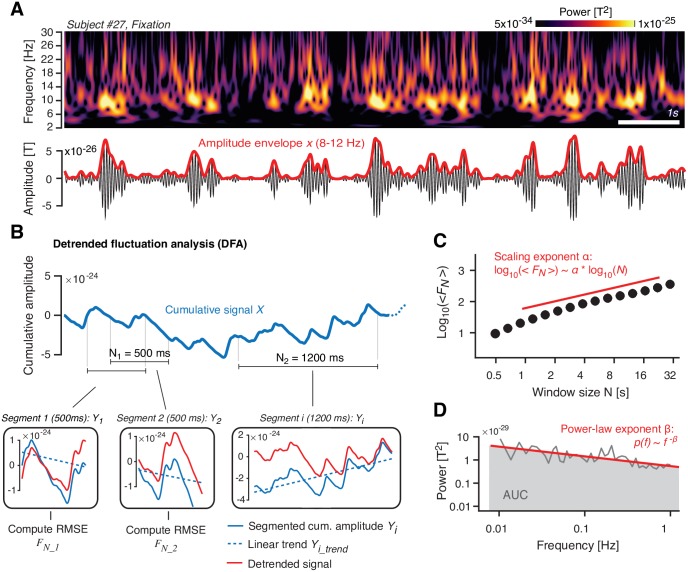
Fig 2. Quantifying the temporal structure of fluctuations in oscillatory cortical activity.
(A) Top: Time–frequency representation of MEG power fluctuations during Fixation (example subject). Bottom: Filtered signal (10 Hz; black) and the corresponding amplitude envelope (red). (B) Illustration of detrended fluctuation analysis. See main text (Materials and methods) for details. Top: Cumulative sum of the amplitude envelope. Bottom: Detrending of cumulative sum within segments, shown for two different window lengths N (N1 = 500 ms and N2 = 1,200 ms). (C) Fluctuation function <FN>. In log-log coordinates, <FN> increases approximately linearly as a function of N, with a slope that is the scaling exponent α. (D) Illustration of power spectrum analysis of amplitude envelope. In log-log coordinates, the power spectrum can be approximated by a straight line, with a slope β (power-law exponent) and an AUC (gray) that quantifies the overall variance of the signal. The data can be found at https://figshare.com/articles/Example_Figure_Fig_2_/5787321. AUC, area under the curve; FN, RMSE fluctuation averaged across segments of length N; MEG, magnetoencephalography; RMSE, Root-mean-square error; T, Tesla.

