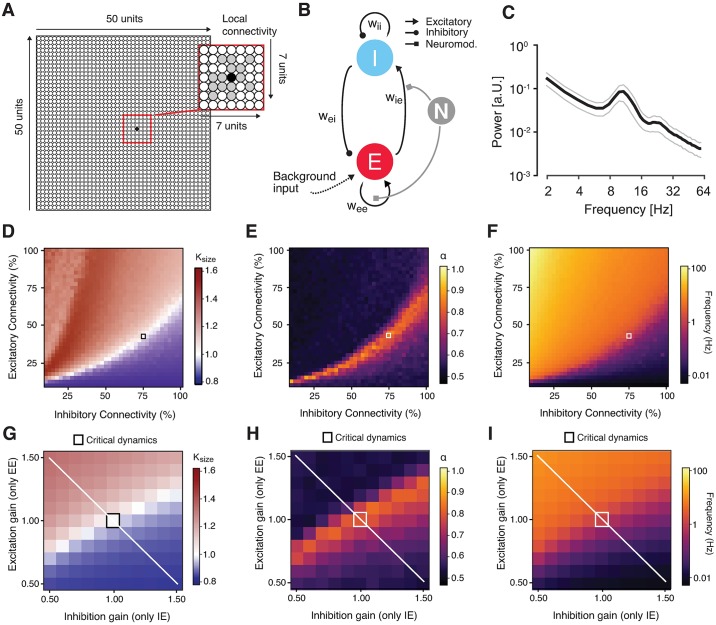
Fig 8. Changes in scaling behavior in a neural network under gain modulation.
(A)–(I) Dynamic modulation of excitation-inhibition ratio alters long-range temporal correlations in recurrent network model. (A) Model architecture. The network consisted of 2,500 excitatory and inhibitory integrate-and-fire units and random, local (within an area of 7 x 7 units) connectivity (magnified within the red square). (B) Neuromodulation was simulated as a gain modulation term multiplied with excitatory synaptic weights (wee and wie). (C) Power spectrum of the simulated neural mass activity, with a peak in the alpha range. (D) κ as a function of excitatory and inhibitory connectivity (with a spacing of 2.5%; means across 10 simulations per cell). The region of κ~1 overlaps with the region of α > 0.5 and splits the phase space into an excitation-dominant (κ > 1) and an inhibition-dominant region (κ < 1). The black square depicts the network configuration that was chosen for assessing the effects of neuromodulation. (E) Scaling exponent α as a function of excitatory and inhibitory connectivity. (F) Same as (D) and (E), but for mean firing rate. (G) κ as a function of independent synaptic gain modulation. Red square, baseline state of critical network before synaptic gain modulation. White line, axis corresponding to largest change in E/I ratio. (H) Same as (D), but for scaling exponent α. (I) Same as (G) and (H), but for firing rate. The code and the data underlying these plots can be found at https://figshare.com/s/374ab0f973f026535549. EE, excitatory-to-excitatory (recurrent excitation); EI, inhibitory-to-excitatory; IE, excitatory-to-inhibitory; II, inhibitory-to-inhibitory (recurrent inhibition); κ, kappa index; w, synaptic weight.

