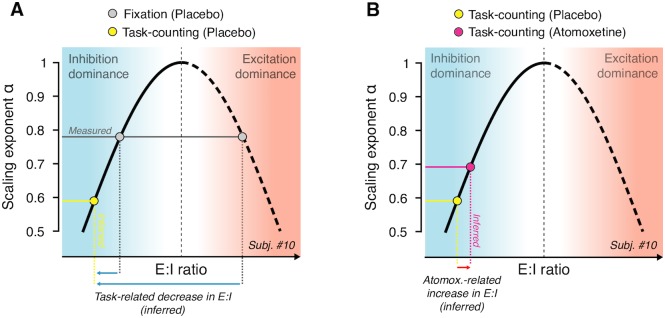
Fig 9. Schematic of inference from observed change in scaling exponents to net E/I ratio (see Results for details).
The nonmonotonic dependence of scaling exponent α on E/I ratio (corresponding to white line in Fig 8H) is replotted schematically. (A) Measured scaling exponent α during Fixation (gray) can result from both inhibition- or excitation-dominant regimes; the baseline is unknown. Assuming that sensory drive (Task-counting; yellow dot) either decreases or does not change E/I ratio, the observed decrease in scaling exponent during Task-counting (yellow) reflects a shift towards inhibition dominance (blue arrows), consistent with animal physiology [53,54]. (B) This constrains the baseline state for the interpretation of the atomoxetine-induced increase in scaling exponent during Task-counting (red): the latter increase likely reflects an increase in E/I ratio (red arrow). E/I, excitation–inhibition.

