Figure 2.

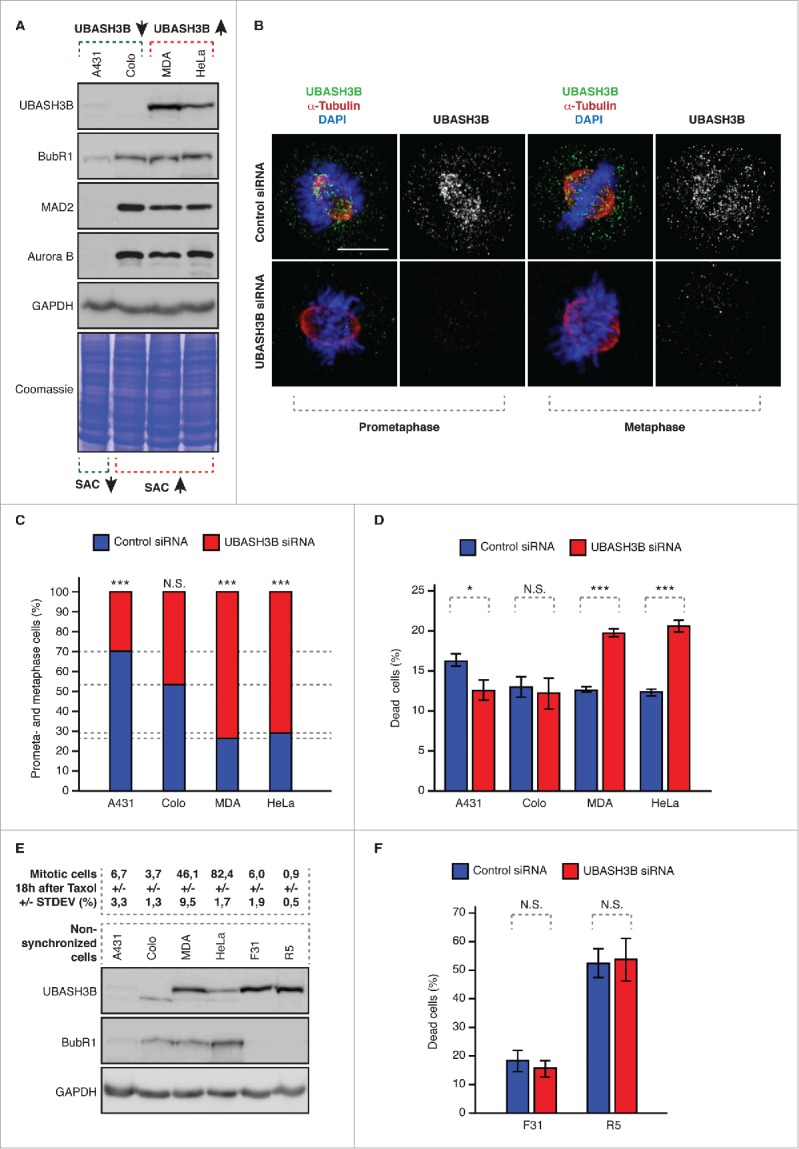
Downregulation of UBASH3B leads to potentiation of SAC in cancer cells. (A) Indicated cancer cell lines were analyzed by Western blotting. Colo = Colo 320DM, MDA = MDA-MB-231, HeLa = HeLaWS (B) MDA-MB-231 were treated by control and UBASH3B small interfering RNAs (siRNAs), synchronized by double thymidine block and release in mitosis and analyzed by immunofluorescence microscopy. Examples of prometaphase and metaphase cells are depicted. (C) Indicated cancer cell lines were treated by control (blue bars) and UBASH3B siRNAs (red bars), analyzed as in (B) and the numbers of cells (average of n = 6200 per cell line) in prometa- and metaphase-like stages were quantified. Equal numbers of cells were analyzed per control and UBASH3B siRNA groups for each cell line. Next, numbers of prometaphases and metaphases were quantified per control and UBASH3B siRNAs (equals 100%) and fractions of preanaphase cells in both groups were determined to show the differences between control and UBASH3B siRNA groups. (D) Indicated cancer cell lines were treated by control (blue bars) and UBASH3B siRNAs (red bars) for 48h, and percentage of dead cells was quantified. At least 500 cells were analyzed per each data point. (E) Upper panel: indicated cancer cell lines and primary fibroblasts (F31 and R5) were treated with Taxol (paclitaxel), analyzed by immunofluorescence microscopy and percentage of mitotic cells was quantified (average of n = 3000 per cell line). STDEV indicates standard deviation. Lower panel: indicated cancer cell lines and primary fibroblasts (F31 and R5) were analyzed by Western blotting. (F) Primary fibroblasts (F31 and R5) were analyzed as in (D) and percentage of dead cells was quantified. At least 500 cells were analyzed per each data point. In all experiments “***” indicates the P value of less than 0.001, “*”- less than 0.05, and N.S. indicates nonsignificant difference.
