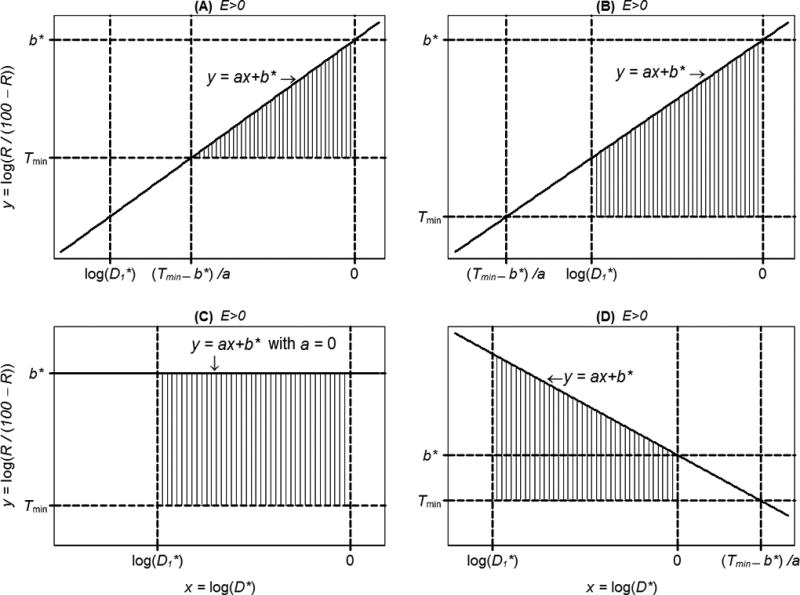
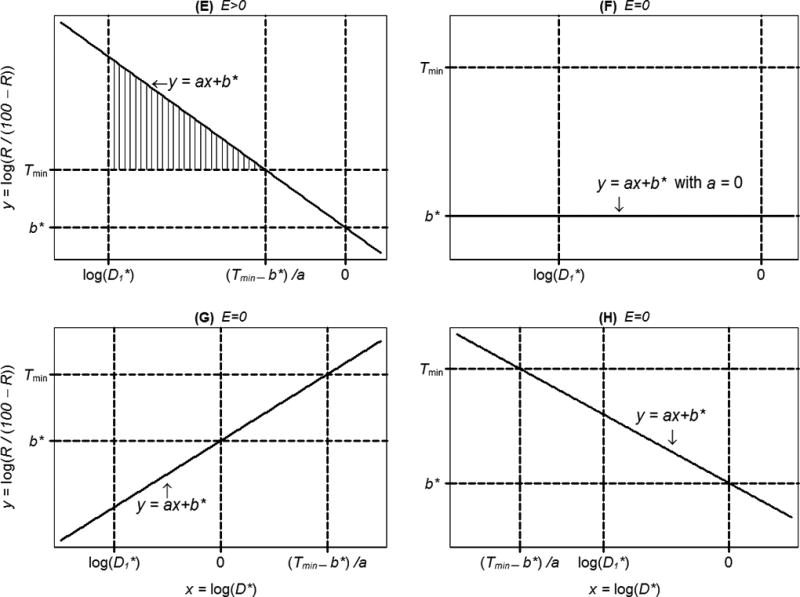
Figure 3.


Illustration of five situations producing a compound effect size E > 0 (A–E), and three producing E = 0 (F–H) (continued). In A through E, the area of the region highlighted with vertical lines is equal to E. Referring to formulas (11)–(13), plot (A) corresponds to the case a > 0, b* > Tmin and ; in plot (B), a > 0, b* > Tmin, but ; (C) a = 0, yielding E > 0 because b* > Tmin; (D) a < 0, and min {(Tmin − b*)/a, 0} = 0; (E) a < 0, and min {(Tmin − b*)/ a, 0} = (Tmin − b*)/ a ; (F) a = 0, yielding E = 0 because b* < Tmin ; (G) a > 0, b* < Tmin; (H) a < 0 and .
