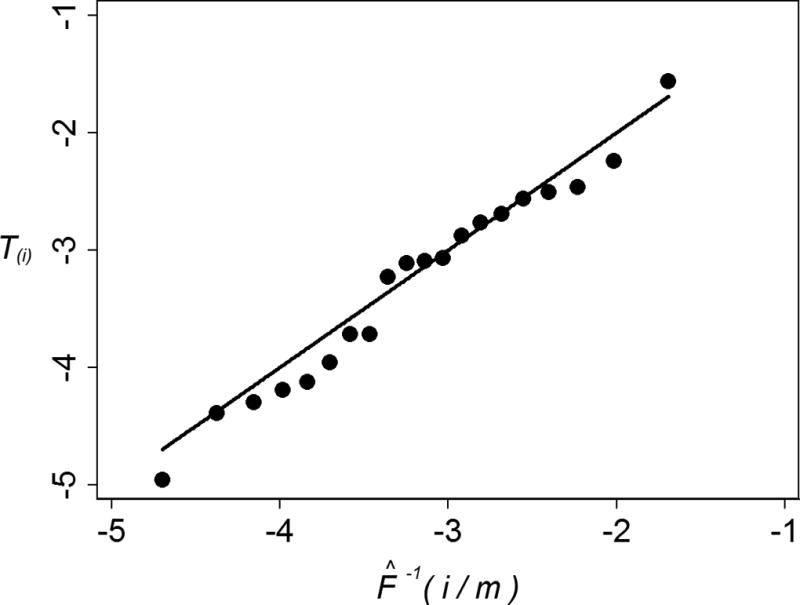
Figure 4.

Quantile-quantile (Q-Q) plot for model of detection limit estimated with virus-infection neutralization data. The points tend to align along a straight line with slope 1 and intercept 0, suggesting that pdf (10) is a reasonable model of the detection limit for percent neutralization responses, and therefore, that an estimated detection limit of 4.42% is reasonable for these responses. The Q-Q plot was made with 1 the points (F̂−1(i/m), T(i)), i = 1, …, 21 − 1, where T(1) ≤ … ≤ T(21) are the order statistics of the 21 transformed responses in Table 1 which were used to estimate the parameters α, β, θ and γ2 of pdf (10), and F̂ is an estimate of the cumulative distribution function corresponding to this pdf, which was computed with the maximum-likelihood estimates of these parameters.
