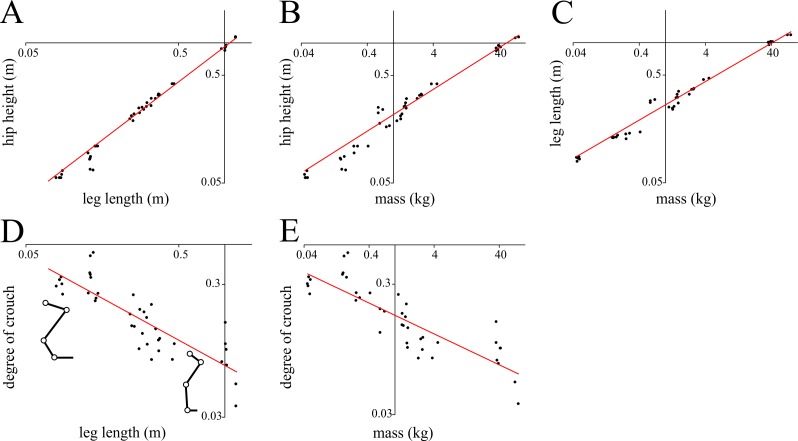
Fig 1. Morphometric scaling observed in the birds investigated in the current study.
(A) Hip height versus leg length. (B) Hip height versus body mass. (C) Length versus body mass. (D) Degree of crouch versus leg length; stick figure representations show the range of crouched (e.g., quail) to erect (e.g., ostrich) postures exhibited by birds. (E) Degree of crouch versus body mass. All comparisons are plotted on logarithmic scales. Note that in (A)–(C), the line of best fit was determined by applying a power I fit on the untransformed variables, rather than applying a linear fit to the log-transformed values. This helped produce better results for the upper end of the body mass spectrum. Regression equations are reported in Table 2.

